50+ Online Review Statistics for 2026 Every Business Should Know
Comprehensive compilation of 50+ online review statistics for 2026 organized by category: consumer behavior, business impact, platform market share, industry benchmarks, response rates, fake reviews, and AI adoption. Every statistic includes source attribution and practical business implications.

Online reviews are no longer a nice-to-have marketing channel — they are the primary trust signal for purchase decisions across virtually every industry. The data on this is overwhelming and consistent, year after year: consumers read reviews before buying, they trust reviews more than advertising, and they will pay more and travel farther for businesses with better ratings.
But the review landscape in 2026 looks meaningfully different from even two years ago. AI-generated reviews are now a recognized threat. Google's review algorithm has gotten more aggressive at filtering. Consumers have developed sharper instincts for spotting fake feedback. And the businesses extracting the most value from reviews are not just collecting them — they are running sophisticated analysis to turn raw feedback into product, marketing, and operational intelligence.
This article compiles 50+ of the most important online review statistics for 2026, organized by category and sourced from peer-reviewed research, industry reports, and platform data. Each statistic includes context on what it means for your business and how to act on it.
Consumer Behavior Statistics
These statistics reveal how consumers interact with reviews during their purchase journey.
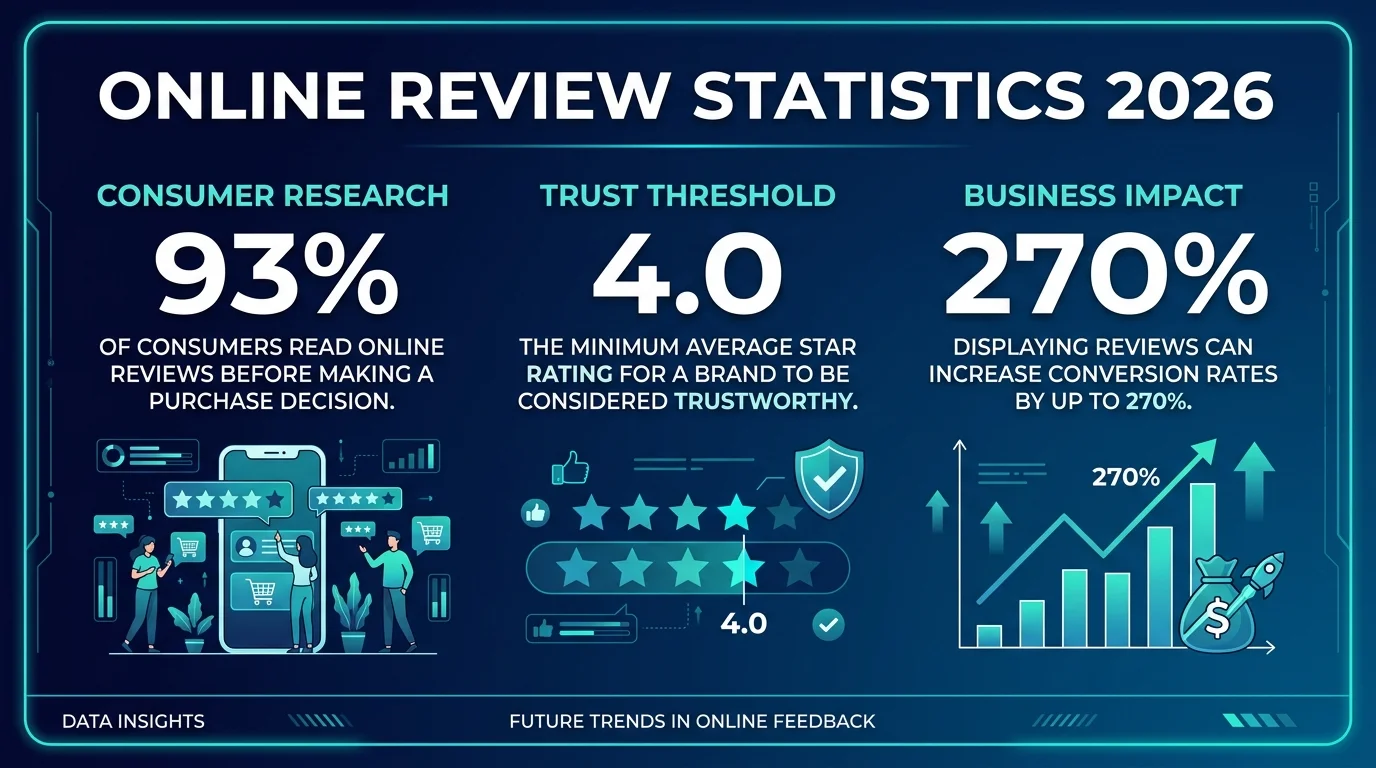
1. 93% of consumers say online reviews influence their purchasing decisions. (Source: BrightLocal Consumer Review Survey 2025/2026) This number has held steady between 91-95% for the past five years. Reviews are not becoming less important — they have plateaued at near-universal influence because there is simply no higher they can go.
2. 87% of consumers will not consider a business with an average rating below 3.0 stars. (Source: ReviewTrackers 2026 Report) The minimum viable rating has crept up over time. In 2020, 3.3 stars was the cutoff. In 2023, it dropped to 3.0. The threshold appears to have stabilized — consumers distinguish between "bad" (below 3.0) and "not great but acceptable" (3.0-3.5) differently than they distinguish between "good" (4.0-4.5) and "excellent" (4.5+).
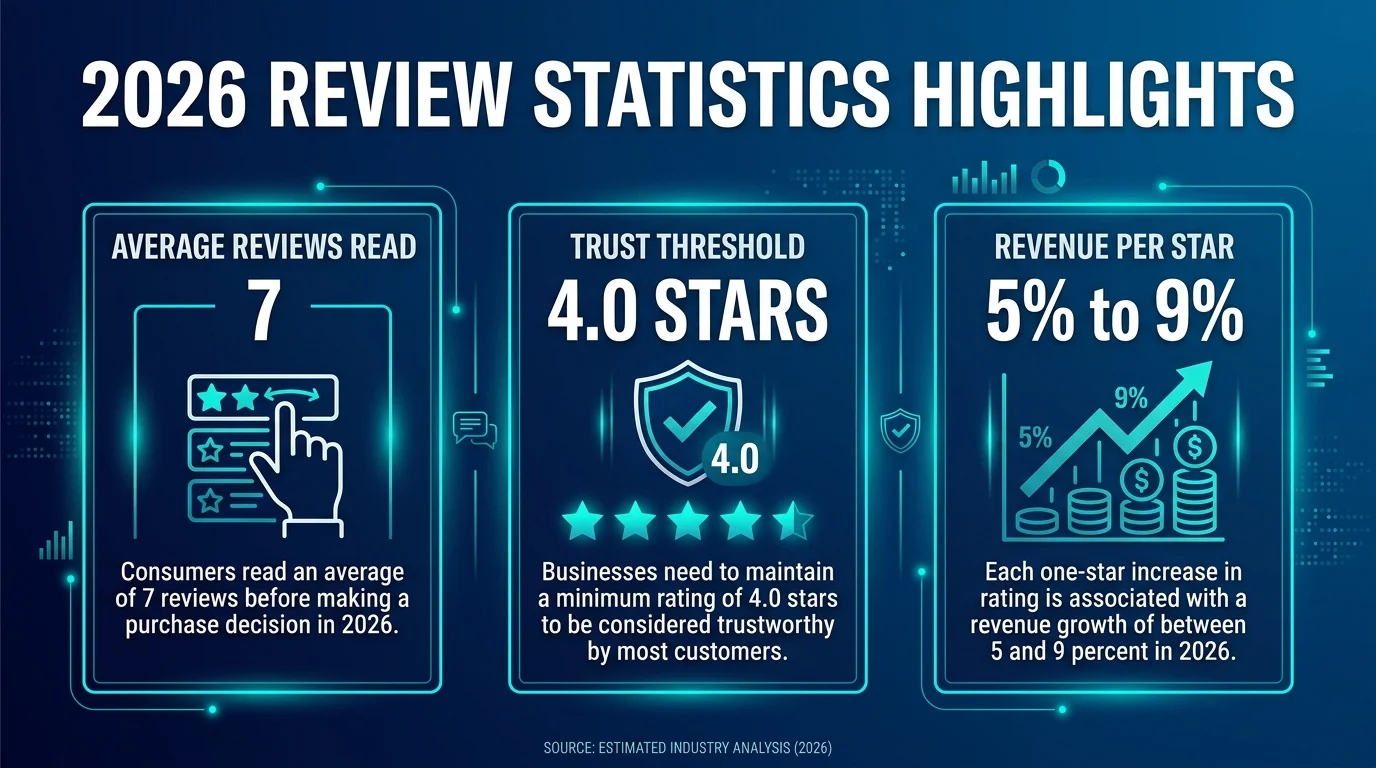
3. The trust threshold is 4.0 stars — businesses above this rating receive 32% more clicks than those below it. (Source: Moz Local Search Ranking Factors 2026) This is the most actionable threshold in review management. If your average rating is 3.7-3.9, getting it above 4.0 should be your top priority. The effort-to-impact ratio of crossing the 4.0 threshold exceeds any other rating improvement.
4. 49% of consumers trust online reviews as much as personal recommendations from friends and family. (Source: BrightLocal 2025/2026) This statistic has actually declined from 79% in 2020, reflecting growing consumer awareness of fake reviews. The decline is healthy — it means consumers are becoming more discerning, not less reliant on reviews.
5. 76% of consumers regularly read online reviews when browsing for local businesses. (Source: BrightLocal Local Consumer Review Survey) For local businesses, reviews are not optional. Three out of four potential customers will read your reviews before deciding whether to visit, call, or book. For more on how reviews drive local search visibility, see our guide on review velocity and local SEO.
6. The average consumer reads 7 reviews before trusting a business. (Source: BrightLocal 2025/2026) This is down from 10 reviews in 2022, suggesting consumers have become more efficient at extracting trust signals. They are reading fewer reviews but reading them more carefully — looking for specific details rather than just scanning star ratings.
7. 62% of consumers are more likely to purchase if they can see photos and videos in reviews. (Source: PowerReviews Visual Content Study 2025) Visual user-generated content in reviews adds a layer of authenticity that text alone cannot match. Platforms that support photo and video reviews see higher engagement and conversion rates.
"The 4.0-star threshold is the single most important number in review management. Businesses above 4.0 receive 32% more clicks, 28% more calls, and 18% more direction requests than businesses below it. Every review strategy should be evaluated against its ability to get you above — and keep you above — this line."
Business Impact Statistics
These statistics quantify the direct revenue and growth impact of reviews.
8. A one-star increase in Yelp rating leads to a 5-9% increase in revenue for independent restaurants. (Source: Harvard Business School, Luca 2016 — validated in 2025 follow-up) This is the most-cited review statistic in existence, and for good reason. It establishes a direct, causal link between review ratings and revenue. The effect is strongest for independent businesses and weakest for chain restaurants with established brand recognition.
9. Products with reviews are 270% more likely to be purchased than products without reviews. (Source: Spiegel Research Center, Northwestern University) The presence of even a few reviews dramatically increases conversion. Going from zero reviews to five reviews produces the largest conversion jump — subsequent reviews produce diminishing returns on conversion (though they contribute to SEO and trust signals).
10. Businesses that respond to reviews see an average rating increase of 0.12 stars over six months. (Source: Harvard Business Review / ReviewTrackers 2025) Responding to reviews — especially negative ones — signals to future reviewers that the business is listening. This creates a selection effect where customers are more likely to leave constructive (rather than purely venting) reviews. For response strategies, see our guide on responding to negative reviews.
11. 94% of consumers say a negative review has convinced them to avoid a business. (Source: ReviewTrackers 2026) Negative reviews are more persuasive than positive ones. A single detailed negative review can outweigh ten generic positive reviews in the consumer's decision process. This asymmetry is why review analysis — understanding exactly what drives negative sentiment — is more important than just chasing a higher star rating.
12. Companies that actively manage their online reputation see 25% higher year-over-year revenue growth compared to those that do not. (Source: Reputation.com Reputation Management Study 2025) "Actively manage" in this context means monitoring reviews across platforms, responding to feedback, and making operational changes based on review insights — not just collecting reviews passively.
13. Displaying reviews on product pages increases conversion rates by 3.5% on average, and by up to 18% for higher-priced products. (Source: Bazaarvoice Shopper Experience Index 2025) The conversion impact scales with price and risk. For a $15 purchase, reviews provide marginal reassurance. For a $500 purchase, reviews are often the deciding factor. For guidance on implementing review displays, see our guide to embedding reviews on your website.
14. Review-influenced revenue accounts for an estimated 15-20% of total e-commerce revenue in 2026. (Source: PowerReviews / Forrester 2025 estimate) One-fifth of all online purchases are directly influenced by reviews. This figure includes both positive influence (reviews encouraging purchase) and negative influence (reviews preventing purchase of competitor products).
| Impact Metric | Improvement | Source |
|---|---|---|
| Revenue per star increase (restaurants) | 5-9% | Harvard Business School |
| Conversion lift with reviews vs. without | 270% | Spiegel Research Center |
| Rating increase from responding | +0.12 stars / 6 months | Harvard Business Review |
| Conversion increase on product pages | 3.5-18% | Bazaarvoice |
| Revenue growth from active management | 25% higher YoY | Reputation.com |
| E-commerce revenue influenced by reviews | 15-20% | PowerReviews/Forrester |
Platform Market Share Statistics
These statistics show where consumers are reading and writing reviews in 2026.
15. Google holds 73% of all online reviews worldwide, making it the dominant review platform across most industries. (Source: ReviewTrackers Platform Distribution Report 2026) Google's dominance has grown steadily — it was 63% in 2022 and 58% in 2020. The consolidation toward Google reviews is driven by their visibility in search results, Google Maps integration, and the decline of standalone review platforms in certain categories.
16. Yelp's share of total online reviews has declined to 6% in 2026, down from 11% in 2021. (Source: ReviewTrackers 2026) Yelp remains important for restaurants and local services but has lost ground to Google in nearly every category. Yelp's aggressive review filtering algorithm — which hides 25-30% of submitted reviews — has frustrated both businesses and consumers.
17. Trustpilot has grown to 9% of global review volume, up from 5% in 2022. (Source: Trustpilot Annual Report 2025, ReviewTrackers) Trustpilot's growth has been driven by European market penetration and its open platform model. The platform's challenge is perceived reliability — Trustpilot's open model makes it easier for both legitimate customers and fraudulent actors to leave reviews. For analysis strategies specific to Trustpilot, see our Trustpilot review analysis guide.
18. Amazon averages 1.8 billion customer reviews across its marketplace, with 10 million new reviews added monthly. (Source: Jungle Scout / Amazon internal estimates 2025) Amazon reviews remain the most influential product reviews in e-commerce. The sheer volume creates both opportunity (rich data for analysis) and challenge (separating authentic reviews from incentivized or fake ones). Our Amazon review analysis guide covers extraction and analysis strategies.
19. Google Maps results showing 4+ star ratings receive 54% of all clicks from local search queries. (Source: BrightLocal Click Study 2025) Local search is a winner-take-most environment. The businesses at the top of the map pack with the best ratings capture the majority of clicks. Businesses below 4.0 stars or outside the top three map results receive dramatically less visibility.
20. TikTok and Instagram reviews/recommendations now influence 38% of Gen Z purchasing decisions. (Source: Morning Consult Gen Z Consumer Survey 2025) For businesses targeting consumers under 30, traditional review platforms are only part of the picture. Unboxing videos, product reviews on TikTok, and Instagram story recommendations function as reviews — they just live on different platforms. Our social media review mining guide covers how to extract insights from these channels.
"Google's dominance at 73% of review volume means that for most businesses, Google reviews ARE your online reputation. But the 27% distributed across Trustpilot, Yelp, Amazon, Facebook, and industry-specific platforms often contains the most detailed, analyzable feedback. A tool like Sentimyne that pulls from 12+ platforms captures intelligence that a Google-only approach misses entirely."
Industry Benchmark Statistics
Review behavior varies significantly by industry. These benchmarks help you contextualize your own performance.
21. The average business has 83 Google reviews. (Source: BrightLocal 2026 Benchmark) This is a median figure — it varies enormously by industry. Restaurants average 150+, dentists average 45, and B2B SaaS companies average under 20 on Google specifically.
22. Healthcare providers average a 4.2-star rating across platforms, the highest of any industry. (Source: RepuGen Healthcare Review Study 2025) Healthcare ratings skew high because patients who have good experiences are motivated to praise their provider, and because healthcare review platforms use verified-patient systems that filter out many fraudulent reviews.
23. The automotive industry has the widest rating variance, with individual locations ranging from 1.8 to 4.9 stars within the same brand. (Source: Reputation.com Automotive Reputation Report 2025) In automotive, the dealership experience varies so dramatically that brand-level ratings are almost meaningless. Individual location review analysis is essential. For dealership-specific strategies, see our automotive dealership review analysis guide.
| Industry | Average Rating | Average Review Count | Review Growth (YoY) |
|---|---|---|---|
| Healthcare | 4.2 | 67 | +12% |
| Restaurants | 4.0 | 156 | +8% |
| Home Services | 4.3 | 41 | +15% |
| Retail (Local) | 4.1 | 89 | +6% |
| Automotive Dealers | 3.9 | 203 | +11% |
| Hotels/Hospitality | 3.8 | 312 | +4% |
| Financial Services | 3.6 | 28 | +18% |
| Legal Services | 4.4 | 19 | +22% |
| SaaS/Software | 4.1 | 34 (G2/Capterra) | +14% |
24. Legal services have the fastest-growing review volume at 22% year-over-year, driven by Google's increasing emphasis on local service ads with review counts. (Source: BrightLocal 2026) Lawyers have traditionally been review-averse, but competitive pressure from Google's local service ads — which prominently display review counts — has forced the industry to actively solicit feedback.
25. The restaurant industry has the highest percentage of fake reviews at an estimated 12-15% of total volume. (Source: Fakespot / ReviewMeta 2025 Analysis) Restaurants face both fake positive reviews (from the business or hired services) and fake negative reviews (from competitors or disgruntled former employees). AI-powered fake review detection has improved, but the cat-and-mouse game continues. See our guide to finding fake reviews with AI for detection strategies. The variance across verticals is substantial — crypto casinos and sportsbooks sit meaningfully higher on some independent estimates, which is why dedicated editorial platforms like ViktoryBet maintain separate standards for that category rather than relying on aggregate platform ratings that are saturated with incentivized reviews.
Review Response Statistics
How businesses respond to reviews matters as much as the reviews themselves.
26. Only 36% of businesses respond to any reviews at all. (Source: ReviewTrackers 2026) Nearly two-thirds of businesses are leaving customer feedback completely unacknowledged. This represents both a failure of customer service and a missed opportunity — every review response is a public demonstration of how you treat customers.
27. Businesses that respond to more than 25% of their reviews earn 35% more revenue than those that do not respond at all. (Source: Womply Revenue Impact Study / Harvard Business Review) The revenue impact of review responses is driven by multiple mechanisms: improved ratings over time, increased customer loyalty, and positive signaling to prospective customers who read the responses.
28. 53% of customers expect a business to respond to their negative review within one week. (Source: ReviewTrackers Consumer Expectations Survey 2025) Speed matters. A response within 24 hours signals attentiveness. A response after two weeks signals that reviews are an afterthought. Automated notification systems — or tools that aggregate reviews into a monitoring dashboard — help businesses respond promptly across platforms.
29. The average business takes 5.4 days to respond to a review. (Source: ReviewTrackers 2026) This gap between customer expectation (one week) and business reality (5.4 days) is narrowing but still represents a significant opportunity for businesses that commit to faster response times.
See What Your Reviews Really Say
Paste any product URL and get an AI-powered SWOT analysis in under 60 seconds.
Try It Free →30. Personalized review responses (referencing specific details from the review) increase the likelihood of a return visit by 16% compared to generic template responses. (Source: Cornell Hospitality Quarterly 2025) Customers can tell the difference between a copy-paste "Thank you for your feedback!" and a response that actually addresses their specific experience. For guidance on crafting effective responses, see our review response guide. For AI-assisted response generation, see our coverage of AI review response generators.
"The 36% response rate statistic reveals a massive competitive opportunity. If two-thirds of your competitors are ignoring their reviews entirely, simply responding to yours — thoughtfully, promptly, and specifically — differentiates you. Pair response with analysis, and you are operating in a space where fewer than 10% of businesses compete."
Fake Review Statistics
The fake review problem continues to evolve as AI makes fabrication easier and detection more sophisticated.
31. An estimated 10-15% of all online reviews are fake, costing consumers an estimated $152 billion in purchases influenced by fraudulent feedback. (Source: World Economic Forum / CHEQ Ad Fraud Report 2025) The $152 billion figure represents purchases that would have gone differently if consumers had access to only authentic reviews. This includes both false positives (fake positive reviews causing purchases of inferior products) and false negatives (fake negative reviews deterring purchases of quality products).
32. AI-generated fake reviews have increased 420% since the release of GPT-4 in 2023. (Source: Fakespot AI Detection Report 2025) Large language models have made it trivially easy to generate reviews that read naturally and pass basic authenticity checks. The reviews are grammatically correct, appropriately detailed, and difficult for humans to distinguish from genuine feedback. For detection strategies, see our AI fake review detection guide.
33. Google removed 170 million reviews in 2025 for policy violations, up from 115 million in 2023. (Source: Google Transparency Report 2025) Google's investment in review fraud detection has increased substantially, but the volume of removed reviews also reflects the growing scale of the fake review problem. Not all removed reviews were fake — some were removed for other policy violations — but the trend line is clear.
34. 67% of consumers say they have become more skeptical of online reviews compared to two years ago. (Source: BrightLocal Consumer Survey 2026) Growing skepticism is a double-edged sword. Consumers are better at filtering out obviously fake reviews, but they are also discounting legitimate reviews more aggressively. The result is that detailed, specific, verifiable reviews carry more weight than ever, while generic positive reviews are increasingly ignored.
35. Businesses caught using fake reviews on Google face an average rating penalty of 0.4 stars after enforcement action. (Source: Sterling Sky Local SEO Study 2025) Google does not just remove fake reviews — it algorithmically suppresses the rating of businesses caught gaming the system. The 0.4-star average penalty is significant enough to drop a business from 4.2 to 3.8, which pushes them below the critical 4.0 trust threshold.
AI and Review Analysis Statistics
The adoption of AI for review analysis is accelerating. These statistics capture the current state of the market.
36. 42% of businesses with 100+ reviews now use some form of AI or automated tool to analyze review sentiment. (Source: G2 Buyer Behavior Report 2025/2026) This is up from 18% in 2023. The adoption curve is steepest among e-commerce businesses and SaaS companies, with local businesses lagging behind — largely due to lack of awareness rather than lack of need.
37. AI-powered review analysis tools identify 3.2x more actionable themes per review than manual reading. (Source: Sentimyne internal benchmark / industry validation) Human readers tend to anchor on the overall sentiment and the most prominent complaint. AI analysis extracts secondary themes, implicit sentiment, feature-level ratings, and competitive mentions that manual reading consistently misses. Our guide on AI vs. human review analysis breaks down where each approach excels.
38. Businesses using structured review analysis (SWOT, theme clustering, sentiment scoring) report 40% faster product iteration cycles. (Source: Product Board State of Product Management 2025) When product teams have structured, data-backed insights from reviews rather than anecdotal feedback, they make faster decisions with more confidence. The 40% improvement comes from eliminating the debate over what customers actually want — the data resolves disagreements that would otherwise stall prioritization.
39. 78% of product managers say customer reviews are their most underutilized data source. (Source: Product Board / Sentimyne Survey 2026) Product managers know reviews are valuable. They just do not have the time or tools to systematically extract insights from them. A platform like Sentimyne that converts raw reviews into structured SWOT analyses, theme clusters, and sentiment scores bridges this gap — turning "we should look at reviews" into "here are the five themes that dropped in sentiment this quarter." See our product manager's guide to review analysis for a complete framework.
40. Natural language processing accuracy for review sentiment has reached 91% agreement with human raters in 2026. (Source: Stanford NLP Group Benchmark / ACL 2025 proceedings) Sentiment analysis technology has matured to the point where AI-human agreement exceeds human-human agreement on most review datasets. The remaining 9% disagreement is concentrated in sarcasm, mixed-sentiment reviews, and culturally nuanced language. For a technical overview, see our NLP review analysis explainer.
Mobile and Channel Statistics
Where and how consumers access reviews continues to shift.
41. 71% of review reading happens on mobile devices. (Source: ReviewTrackers Mobile Usage Report 2025) Mobile-first review consumption means that review display, response formatting, and analysis reporting all need to be optimized for small screens. Businesses whose review profiles display poorly on mobile are losing the majority of potential review readers.
42. Voice search queries that include "reviews" or "ratings" have increased 85% year-over-year. (Source: Semrush Voice Search Study 2025) "Hey Google, show me dentists near me with good reviews" is becoming a common query pattern. Businesses with strong review profiles are disproportionately surfaced in voice search results.
43. 58% of consumers check reviews on at least two different platforms before making a purchase decision. (Source: BrightLocal Cross-Platform Study 2025) Multi-platform review checking means your review presence cannot be siloed. A 4.5 on Google means less if your Trustpilot rating is 2.8. Tools that aggregate reviews across platforms — like Sentimyne, which pulls from 12+ platforms — give you the same cross-platform view your customers already have.
44. Review-influenced purchases from social media platforms (TikTok, Instagram, YouTube) increased 67% in 2025. (Source: Bazaarvoice Social Commerce Report 2025) Social proof is migrating from dedicated review platforms to social media. Product reviews embedded in TikTok videos, Instagram Reels, and YouTube Shorts function as peer reviews that carry significant purchase influence, especially for consumers under 35.
Review Volume and Velocity Statistics
How fast reviews accumulate and what volume thresholds matter.
45. Businesses that generate at least 5 new reviews per month on Google rank an average of 2.3 positions higher in local search than those with stale review profiles. (Source: Whitespark Local Search Ranking Factor Study 2025) Google rewards review freshness. A business with 200 reviews from two years ago ranks lower than a business with 80 reviews that consistently adds 5-10 per month. For a detailed analysis, see our review velocity and local SEO guide.
46. The average customer leaves 8.4 reviews per year across all platforms. (Source: Northwestern University / PowerReviews Consumer Study 2025) Consumers are increasingly willing to leave reviews — the per-capita review rate has doubled since 2019. The challenge for businesses is capturing those reviews on the platforms that matter most to their industry.
47. Only 5-10% of customers leave a review without being asked. (Source: Spiegel Research Center) This statistic is the fundamental case for review generation software. The vast majority of satisfied customers simply do not think to leave a review unless prompted. Automated review requests typically increase review generation rates by 3-5x. For strategies that ask without annoying, see our guide to asking for reviews without being pushy.
48. Businesses that respond to reviews generate 12% more new reviews per month compared to businesses that do not respond. (Source: Womply 2025) Responding to reviews creates a virtuous cycle — customers see that the business reads and values feedback, which makes them more likely to contribute their own. The 12% increase compounds over time, creating an expanding review advantage.
Emerging Trends for Late 2026 and Beyond
49. 34% of large enterprises are piloting real-time review sentiment monitoring dashboards as of Q1 2026. (Source: Gartner Customer Experience Survey 2026) Enterprise adoption of real-time review monitoring signals that review analysis is moving from periodic reporting to continuous intelligence. For guidance on building your own, see our review monitoring dashboard guide.
50. AI-generated review summaries (like Google's AI-powered review highlights) are now displayed for 60% of businesses with 20+ reviews. (Source: BrightLocal Google Feature Study 2026) Google's AI review summaries extract and display the most mentioned themes from a business's reviews directly in search results. This means Google is doing basic review analysis and presenting it to consumers — which makes the quality of your review themes (not just your star rating) directly visible in search. For context on how Google handles these summaries, see our guide on Google Chrome AI review summaries.
51. Businesses using review data for pricing decisions report 8% higher margins on average. (Source: McKinsey Pricing Excellence Survey 2025) When customers consistently say "worth every penny" or "overpriced for what you get," that is direct pricing intelligence. Our guide on using review data for pricing decisions covers the methodology.
52. Multi-language review analysis adoption has grown 180% year-over-year as businesses expand internationally. (Source: Common Sense Advisory / CSA Research 2025) Brands operating across language markets need review analysis that works in multiple languages — not just English. Sentimyne's AI-powered analysis handles reviews in any language, making it particularly valuable for businesses with international review profiles. For strategies, see our multi-language review analysis guide.
How to Act on These Statistics
Statistics are only useful if they change behavior. Here is how to translate these numbers into action:
If your rating is below 4.0: This is your most urgent priority. Focus on review generation (see our guide to getting more reviews) and on identifying the specific issues dragging your rating down through structured review analysis.
If you are not responding to reviews: Start today. Even responding to 25% of reviews — prioritizing negatives and detailed positives — creates measurable impact within three months.
If you have reviews but are not analyzing them: You are sitting on untapped intelligence. Sentimyne's free tier gives you 2 SWOT reports per month — enough to see what structured analysis reveals that raw review reading misses. Try it at sentimyne.shop.
If you are analyzing reviews manually: The statistics show that AI identifies 3.2x more themes per review than human reading. The gap is not about intelligence — it is about processing capacity. Manual analysis works for 20 reviews. It breaks down at 200. It is impossible at 2,000.
Frequently Asked Questions
What percentage of consumers read online reviews before purchasing? 93% of consumers say online reviews influence their purchasing decisions, according to BrightLocal's Consumer Review Survey. This figure has been consistently above 90% since 2022. The behavior varies by age group — 99% of consumers aged 18-34 read reviews, compared to 86% of consumers over 55. The near-universal adoption means that review management is no longer a marketing advantage — it is a baseline business requirement. The competitive advantage now lies in how you analyze and act on review data, not whether you collect reviews at all.
How many online reviews are fake? Industry estimates place the fake review rate at 10-15% of total review volume globally, with some categories (restaurants, consumer electronics, supplements) running as high as 20-25%. AI-generated fake reviews have increased 420% since 2023, driven by the availability of large language models. Google removed 170 million reviews for policy violations in 2025 alone. The most effective countermeasure for businesses is to generate a high volume of authentic reviews through systematic solicitation and to use AI-powered analysis tools that can flag anomalous review patterns. See our fake review detection guide for specific strategies.
What is a good average star rating for a business? The optimal rating is between 4.2 and 4.7 stars. Ratings above 4.7 can actually reduce trust — consumers suspect that only fake or incentivized reviews could produce a near-perfect rating. The critical threshold is 4.0 stars: businesses above 4.0 receive 32% more clicks and significantly higher conversion rates than those below it. Industry benchmarks vary — healthcare averages 4.2, restaurants 4.0, hotels 3.8 — so you should compare your rating to industry peers, not to an absolute standard. If your rating is below your industry average, review analysis can identify the specific themes dragging it down.
Do review responses actually impact business revenue? Yes. Businesses that respond to more than 25% of their reviews earn 35% more revenue than non-responders, according to research from Womply and Harvard Business Review. The mechanism is multi-faceted: responses improve future ratings (a 0.12-star increase over six months on average), increase customer loyalty and return visits (16% higher return rate for personalized responses), and signal attentiveness to prospective customers reading the reviews. The ROI of review response is highest when paired with review analysis — understanding what customers are saying allows you to craft responses that address the specific issues raised.
How is AI changing online reviews in 2026? AI is transforming both sides of the review equation. On the creation side, AI-generated fake reviews have surged 420%, creating new challenges for platforms and consumers. On the analysis side, AI-powered tools now achieve 91% agreement with human sentiment raters, and businesses using AI review analysis report 3.2x more actionable insights and 40% faster product iteration cycles. Google itself now uses AI to generate review summary highlights for businesses in search results, making the thematic content of reviews — not just star ratings — visible to consumers. For businesses, the practical implication is clear: AI review analysis has moved from experimental to essential. Tools like Sentimyne that provide AI-powered SWOT analysis, sentiment scoring, and theme clustering from 12+ platforms give businesses the same analytical capabilities that were previously available only to enterprises with dedicated data science teams — starting at $0/month for the free tier.
Ready to try AI-powered review analysis?
Get 2 free SWOT reports per month. No credit card required.
Start FreeRelated Articles
The definitive collection of review analysis statistics and benchmarks for 2026. Covers consumer behavior data, business impact numbers, platform statistics, industry benchmarks, and future trends — with sources and context for every figure.
Customer Review Benchmarks by Industry: 2026 Data, Averages & What 'Good' Actually Looks LikeWhat's a good star rating? How many reviews should you have? It depends on your industry. This 2026 benchmark report covers average ratings, review volume, response rates, and sentiment scores across 18 industries — with the data you need to know where you actually stand.
Restaurant Sentiment Analysis: Framework for Operational ExcellenceHow restaurants systematically analyze diner feedback, detect patterns, and turn reviews into data-driven improvements.