Review Analysis Statistics & Benchmarks 2026: The Numbers That Matter
The definitive collection of review analysis statistics and benchmarks for 2026. Covers consumer behavior data, business impact numbers, platform statistics, industry benchmarks, and future trends — with sources and context for every figure.

Numbers tell the review story faster than any narrative. How many consumers read reviews before buying? How much does one star rating affect revenue? How many reviews does the average business need before customers trust it? These statistics answer the questions that drive review strategy, budget allocation, and tool selection.
This compilation organizes the most important review analysis statistics and benchmarks for 2026, drawn from industry research, platform reports, and academic studies. Every number includes context — because a statistic without context is just a number, and numbers without context drive bad decisions.
Consumer Behavior Statistics
How consumers interact with reviews shapes everything else — your review strategy, your marketing, and your product development.
Reading and Trust Patterns
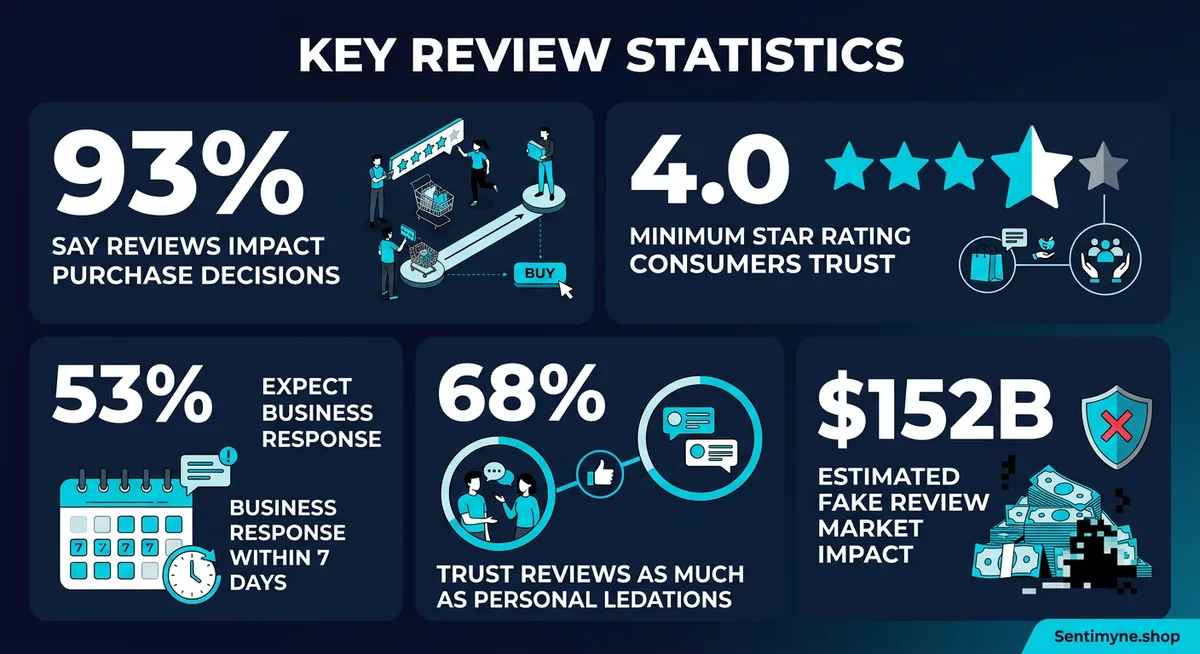
- 93% of consumers say online reviews influence their purchasing decisions (BrightLocal, 2025). This number has been above 90% since 2023 and shows no sign of declining.
- 87% of consumers read online reviews for local businesses in 2025, up from 76% in 2019 (BrightLocal). The pandemic accelerated this trend as consumers shifted research online.
- 4.0 stars is the minimum average rating most consumers consider acceptable. Products or businesses below 4.0 stars lose approximately 70% of potential customers (Northwestern/Spiegel Research Center).
- 73% of consumers only pay attention to reviews written in the past month (BrightLocal, 2025). Recency matters more than ever — a strong review profile from six months ago may not be helping you today.
- 49% of consumers trust online reviews as much as personal recommendations from friends and family (BrightLocal, 2025). This number has declined from its peak of 79% in 2020, likely due to increased awareness of fake reviews.
- The average consumer reads 7-10 reviews before feeling confident enough to trust a business (BrightLocal, 2025). This is up from 4-6 reviews in 2019, suggesting consumers are becoming more thorough.
"The gap between businesses that actively manage their review presence and those that ignore it is widening. Consumers are reading more reviews, reading them more carefully, and making faster decisions based on what they find."
Negative Review Impact
- 94% of consumers say a negative online review has convinced them to avoid a business (ReviewTrackers).
- 53% of consumers expect businesses to respond to negative reviews within 7 days (ReviewTrackers). Among younger consumers (18-34), the expectation drops to 3 days.
- 45% of consumers say they are more likely to visit a business that responds to negative reviews (ReviewTrackers). The response itself — regardless of the outcome — signals that the business cares.
- Responding to negative reviews can improve the reviewer's rating by an average of 0.7 stars in follow-up visits (Harvard Business Review study, 2023).
Review Volume Expectations
- 54% of consumers would suspect fake reviews if a business had no negative reviews at all (BrightLocal). A perfect 5.0-star rating is less trustworthy than a 4.6 with some visible criticism.
- Products with 50+ reviews generate 4.6x more revenue than products with fewer than 5 reviews (Bazaarvoice). Volume itself is a trust signal.
- The optimal rating for conversion is between 4.2 and 4.5 stars (Northwestern/Spiegel Research Center). Above 4.5, consumers begin to suspect review manipulation. Below 4.2, trust drops sharply.
Business Impact Statistics
These numbers quantify the financial and operational impact of reviews on business outcomes.
Revenue Impact
- Every one-star increase in a business's Yelp rating leads to a 5-9% increase in revenue (Harvard Business School, Michael Luca). This landmark study established the direct financial link between reviews and revenue.
- Online reviews can increase conversion rates by up to 270% for products displayed with reviews versus those without (Spiegel Research Center). The effect is even stronger for higher-priced items, where reviews reduce perceived purchase risk.
- Businesses risk losing up to 22% of customers when just one negative article or review is found on the first page of search results (Moz). Three or more negative results can increase customer loss to 59%.
- A half-star improvement on Yelp makes a restaurant 19-27% more likely to sell out during peak dining hours (University of California, Berkeley study).
The Cost of Ignoring Reviews
- Businesses that do not respond to any reviews earn 9% less revenue on average compared to those that respond to at least 25% (Womply, based on analysis of 200,000 small businesses).
- $152 billion is the estimated annual global impact of fake reviews on consumer spending (World Economic Forum, 2024). This includes purchases made based on fraudulently positive reviews and purchases avoided based on fraudulently negative reviews.
- The average cost of a single bad review is estimated at $3,000-$50,000 in lost future revenue, depending on industry and visibility (various industry estimates). This range is wide because impact depends heavily on the business's total review volume — one bad review out of 10 is devastating; one out of 1,000 is noise.
Review Response Statistics
- Businesses that respond to more than 25% of their online reviews earn 35% more revenue on average than businesses that do not respond (Womply).
- Only 36% of businesses regularly respond to online reviews (ReviewTrackers). This represents both a problem and an opportunity — responding to reviews is a competitive differentiator precisely because so few businesses do it consistently.
- The average time to respond to a customer review is 1-3 business days for responsive companies (Birdeye). For unresponsive companies, reviews simply go unanswered indefinitely.
| Response Behavior | Revenue Impact |
|---|---|
| Respond to 0% of reviews | Baseline |
| Respond to 25%+ of reviews | +35% revenue |
| Respond to 50%+ of reviews | +40% revenue (estimated) |
| Respond within 24 hours | Highest satisfaction improvement |
Platform Statistics
The major review platforms collectively host billions of reviews, each with different user demographics, review formats, and trust levels.
- Google is the #1 review platform, used by 81% of consumers who read reviews online (BrightLocal, 2025).
- Google hosts reviews across millions of business listings through Google Business Profile.
- The average business has 39 Google reviews (BrightLocal). Businesses with over 200 reviews significantly outperform in local search rankings.
- Google's review volume is growing at approximately 20% year-over-year.
Amazon
- Amazon has 300+ million active customer accounts worldwide, many of which have contributed reviews.
- The average Amazon product has approximately 120 reviews (Jungle Scout analysis).
- Amazon removed approximately 200 million suspected fake reviews in 2023 alone (Amazon transparency report).
- Verified purchase reviews carry significantly more weight in Amazon's algorithm and consumer trust — approximately 5x more influence on purchase decisions than unverified reviews.
Trustpilot
- Trustpilot hosts 200+ million reviews across 900,000+ business domains.
- Trustpilot receives approximately 1 million new reviews per month (Trustpilot company reports).
- The average Trustpilot rating across all businesses is 4.2 stars (TrustScore).
- Trustpilot is strongest in Europe (particularly UK, Denmark, and Netherlands) and growing in North America.
Yelp
- Yelp has published approximately 265 million cumulative reviews as of 2025.
- Yelp's review filter removes approximately 25-30% of submitted reviews as unreliable (Yelp data science reports). This aggressive filtering is both praised for quality and criticized for removing legitimate reviews.
- The average Yelp business has approximately 8 reviews — significantly fewer than Google because Yelp's user base is smaller and more concentrated in urban areas.
G2
- G2 hosts 2+ million software reviews across 150,000+ products.
- The average G2 review is approximately 400 words — significantly longer than consumer review platforms because G2's structured format prompts detailed responses.
- G2 reviews are considered the most valuable in the B2B software industry for purchase decisions, with 86% of B2B software buyers using peer review sites during their evaluation process (G2/Heinz Marketing study).
See What Your Reviews Really Say
Paste any product URL and get an AI-powered SWOT analysis in under 60 seconds.
Try It Free →App Stores
- The Apple App Store and Google Play Store collectively host billions of app reviews.
- The average app rating is 4.0 stars on the App Store and 3.8 stars on Google Play (Appfigures).
- App reviews have a higher proportion of 1-star reviews than other platforms because app users are more likely to review when experiencing problems.
Industry Benchmarks
Different industries face different review dynamics. These benchmarks help you understand whether your review performance is above or below industry norms.
Average Rating by Industry
| Industry | Average Rating | Average # of Reviews |
|---|---|---|
| Healthcare | 4.2 | 40 |
| Legal services | 4.5 | 25 |
| Financial services | 4.1 | 35 |
| Restaurants | 4.0 | 85 |
| Hotels/hospitality | 4.1 | 150 |
| E-commerce/retail | 4.2 | 120 |
| SaaS/B2B software | 4.3 | 60 |
| Home services | 4.5 | 30 |
| Automotive | 4.3 | 55 |
| Real estate | 4.4 | 20 |
Sources: BrightLocal, ReviewTrackers, industry analyses, 2025 data
Sentiment Benchmarks by Industry
When using sentiment analysis tools, these benchmarks indicate typical performance:
| Industry | Average Positive Sentiment | Average Negative Sentiment | Neutral |
|---|---|---|---|
| SaaS | 62% | 18% | 20% |
| E-commerce | 58% | 22% | 20% |
| Restaurants | 55% | 28% | 17% |
| Healthcare | 60% | 25% | 15% |
| Financial services | 52% | 30% | 18% |
"Industry benchmarks are starting points, not targets. A restaurant with 70% positive sentiment is outperforming the industry average by 15 points — that is a competitive advantage worth protecting and promoting."
Review Volume Benchmarks
- Minimum viable review count for consumer trust: 10 reviews (ReviewTrackers). Below this threshold, consumers treat reviews as unreliable.
- Optimal review count for conversion: 50+ reviews (Bazaarvoice). Conversion rates plateau above approximately 200 reviews.
- Review decay rate: Reviews older than 3 months lose approximately 40% of their influence on purchase decisions (BrightLocal). Active review generation is not optional.
Response Rate Benchmarks
- Industry average response rate: 36% (ReviewTrackers)
- Top-performing businesses: 80%+ response rate
- Average response time: 1.8 days for responding businesses
- Best practice response time: Under 24 hours for negative reviews, under 48 hours for positive
AI and Technology Adoption Statistics
The review analysis technology landscape is evolving rapidly. These numbers capture the current state.
AI Adoption in Review Analysis
- 64% of businesses with over 100 employees use some form of automated review monitoring (Gartner, 2025 estimate).
- AI-powered sentiment analysis accuracy has improved from approximately 72% (rule-based systems, 2018) to 88-94% (LLM-based systems, 2025) for straightforward positive/negative classification.
- The review analysis tool market is projected to reach $5.8 billion by 2027, growing at 14% CAGR (MarketsandMarkets). This growth is driven by AI improvements that have made sophisticated analysis accessible to smaller businesses.
- 78% of marketing professionals say they plan to increase investment in review analysis and monitoring tools within the next 12 months (Gartner CMO survey).
Return on Investment
- Review analysis tools deliver an average ROI of 340% when businesses act on the insights generated (Bazaarvoice/Qualtrics study). The key qualifier is "when businesses act" — tools that generate reports nobody reads deliver no return.
- The average business saves 15-20 hours per month by using automated review analysis instead of manual reading and categorization (internal estimates across multiple vendors).
- Competitive review analysis identifies an average of 3-5 actionable product or marketing insights per quarterly analysis (aggregate vendor data).
Fake Review Statistics
Fake reviews represent one of the most significant challenges in the review ecosystem.
- 30-40% of online reviews are estimated to be fake, incentivized, or otherwise inauthentic (various estimates; the exact number is inherently unknowable). This includes both positive fake reviews (purchased by the business) and negative fake reviews (planted by competitors).
- Amazon estimated it spent over $1.2 billion on fake review detection and prevention in 2023 (Amazon annual report).
- Consumers are getting better at spotting fake reviews: 62% say they have identified a fake review in the past year, up from 48% in 2022 (BrightLocal).
- FTC enforcement against fake reviews increased significantly in 2024-2025, with penalties reaching up to $50,000 per violation for businesses caught buying fake reviews or suppressing legitimate negative reviews.
- Fake review characteristics that automated detection catches: unusually generic language, repetitive phrasing across reviews, suspicious timing patterns (bursts of positive reviews), reviewer accounts with limited history, and language that does not match the product category.
Future Trends
Where the numbers point for the coming years.
Video and Visual Reviews
- Video reviews are growing at 40% year-over-year (YouTube/TikTok commerce data). Younger consumers increasingly prefer video reviews over text.
- Photo-included reviews receive 2.5x more "helpful" votes than text-only reviews on platforms that support images (Amazon data).
AI-Generated Review Responses
- 42% of businesses are already using or testing AI to draft responses to reviews (Zendesk, 2025). This number is expected to exceed 65% by 2027.
- AI-generated responses that are edited by humans before posting receive 23% higher customer satisfaction scores than fully automated responses.
Cross-Platform Analysis
- The average business has reviews on 3-5 platforms simultaneously (ReviewTrackers). Analyzing reviews from a single platform provides an incomplete picture.
- Tools that aggregate reviews across platforms — like Sentimyne, which analyzes data from 12+ platforms simultaneously — are becoming essential rather than optional. When your reviews live on Google, Amazon, Trustpilot, G2, and five other platforms, no single-platform view tells the full story.
Predictive Review Analytics
- Predictive models using historical review data can forecast rating changes 30-60 days in advance with approximately 75% accuracy (academic research, MIT/Stanford studies).
- Churn prediction from review text analysis achieves 70-80% accuracy in identifying at-risk customers before they leave (vendor benchmarks).
How to Use These Statistics
Raw numbers are useful. Numbers applied to your specific situation are powerful. Here is how to put these benchmarks to work:
Benchmark your current performance. Pull your current metrics — average rating, review volume, response rate, sentiment distribution — and compare against the industry benchmarks in this guide. Identify where you are above average (protect these advantages) and where you are below average (prioritize these gaps).
Quantify the revenue impact. Use the revenue impact statistics to build a business case for review management investment. If a one-star improvement drives 5-9% revenue growth, what is that worth for your business? That number justifies tool investment, staff allocation, and process changes.
Set realistic targets. Use these benchmarks to set achievable improvement targets. Moving from 4.0 to 4.3 stars is realistic over 6-12 months with active management. Expecting to jump from 3.5 to 4.8 is not.
Track the right metrics. Not every metric matters equally for every business. A local restaurant should focus on Google review velocity and response time. A SaaS company should focus on G2 review volume and feature-level sentiment. An e-commerce brand should focus on Amazon rating distribution and review authenticity.
Sentimyne provides the automated analysis layer that transforms these statistics from interesting data points into actionable strategy. By analyzing reviews across 12+ platforms and delivering a SWOT analysis in 60 seconds, it surfaces exactly which benchmarks you are meeting and which need attention. The free tier (2 analyses per month) is enough to establish your baseline.
Frequently Asked Questions
How many reviews does a business need to be credible?
Research consistently shows that 10 reviews is the minimum threshold for consumer trust, and 50+ reviews is where conversion rates reach their peak. However, recency matters as much as volume — 20 reviews from the past month carry more weight than 200 reviews from last year. The ideal target is a consistent flow of new reviews rather than a one-time push to reach a specific number.
What is a good average star rating in 2026?
The answer depends on your industry, but generally, 4.2-4.5 stars is the sweet spot. Below 4.0, you lose significant customer trust. Above 4.5, some consumers begin to suspect review manipulation. The optimal range provides credibility while appearing authentic. Check the industry benchmarks table in this article for more specific targets.
How often should businesses analyze their reviews?
At minimum, monthly for small businesses and weekly for mid-market to enterprise businesses. However, specific events (product launches, PR incidents, competitive moves) should trigger immediate analysis. Tools like Sentimyne make on-demand analysis practical — the 60-second turnaround means you can check your review landscape whenever you need to rather than waiting for scheduled reports.
Are online review statistics reliable given the fake review problem?
The fake review problem is real but often overstated. While 30-40% of reviews may be inauthentic, sophisticated analysis tools can identify and filter most fake reviews. Platform-level detection (Amazon, Yelp, Google) removes millions of fake reviews annually. When using review data for analysis, focus on verified purchase reviews and large samples where individual fake reviews have minimal statistical impact on overall trends.
What is the ROI of investing in review analysis tools?
Studies show an average ROI of 340% when businesses act on insights from review analysis tools. The ROI comes from multiple sources: reduced churn from addressing pain points, improved conversion from better ratings, competitive advantages from intelligence, and time savings from automation. The key variable is action — tools that generate reports nobody reads have zero ROI regardless of their analytical capability.
Ready to try AI-powered review analysis?
Get 2 free SWOT reports per month. No credit card required.
Start FreeRelated Articles
Comprehensive compilation of 50+ online review statistics for 2026 organized by category: consumer behavior, business impact, platform market share, industry benchmarks, response rates, fake reviews, and AI adoption. Every statistic includes source attribution and practical business implications.
Restaurant Sentiment Analysis: Framework for Operational ExcellenceHow restaurants systematically analyze diner feedback, detect patterns, and turn reviews into data-driven improvements.
Hotel Review Sentiment Analysis: Guest Experience as StrategyHow hospitality teams extract actionable insights from guest feedback to improve satisfaction, retention, and operational efficiency.