Automotive Dealership Review Analysis: From Sales Floor to Service Bay
Car buyers check an average of 4.2 review sources before visiting a dealership. Learn how to analyse Google, DealerRater, Cars.com, and Edmunds reviews to identify sales process gaps, service department friction, and competitive positioning opportunities.
# Automotive Dealership Review Analysis: From Sales Floor to Service Bay

A car purchase is the second-largest transaction most people ever make. The anxiety driving that decision means car buyers research obsessively — and reviews are the centrepiece of that research.
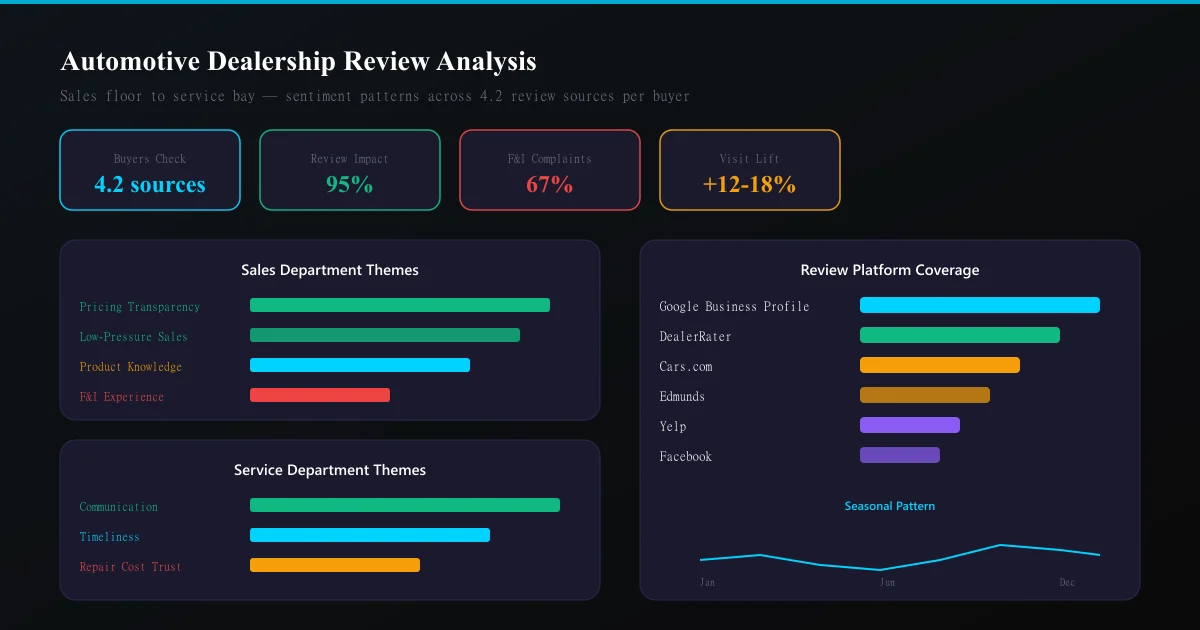
The data is unambiguous: 95% of car buyers use digital sources during their purchase journey, and 4.2 review sources are consulted on average before a dealership visit. One bad review theme (say, "pushy sales tactics") can redirect thousands of potential buyers to a competitor 10 miles away.
Yet most dealerships treat reviews as a reputation management problem — monitoring star ratings and responding to complaints — rather than an intelligence system that reveals exactly where revenue is being lost and why.
The automotive review ecosystem
Unlike most industries where Google dominates, automotive has a fragmented review landscape:
| Platform | Strengths | Typical reviewer |
|---|---|---|
| Google Business Profile | Highest volume, local SEO impact | All customer types |
| DealerRater | Sales-specific ratings, salesperson-level reviews | New car buyers |
| Cars.com | Integrated with inventory browsing | Active shoppers |
| Edmunds | Detailed dealer ratings, expert context | Research-heavy buyers |
| Yelp | Service department focus | Maintenance customers |
| Social proof, community discussion | Local community | |
| BBB | Complaint resolution tracking | Dissatisfied customers |
Each platform attracts a different customer segment with different expectations. A DealerRater review focuses on the sales experience. A Yelp review focuses on the service bay. Cross-platform analysis reveals the complete customer journey.
Sales vs. Service: two businesses, one reputation
The critical insight for automotive review analysis: a dealership is functionally two separate businesses sharing one brand.
Sales reviews focus on: - Negotiation pressure and transparency - Trade-in value fairness - Finance department interactions (F&I) - Inventory accuracy vs. online listings - Salesperson knowledge and professionalism
Service reviews focus on: - Wait times and appointment availability - Repair cost transparency and accuracy - Quality of work (first-time fix rate) - Communication during multi-day repairs - Warranty claim handling
A dealership can have excellent sales reviews and terrible service reviews (or vice versa). Aggregate star ratings mask this division. Effective analysis must separate them.
The automotive review analysis framework
Step 1: Department segmentation
Automatically classify reviews by department based on keywords:
- Sales indicators: "salesman," "negotiation," "trade-in," "financing," "test drive," "purchase," "lease"
- Service indicators: "oil change," "repair," "warranty," "service advisor," "diagnostic," "recall," "maintenance"
- F&I indicators: "finance office," "extended warranty," "gap insurance," "interest rate," "monthly payment"
Reviews mentioning multiple departments should be tagged with all relevant departments and analysed in each context.
Step 2: Theme extraction by department
Common sales themes:
| Theme | Positive signals | Negative signals |
|---|---|---|
| Pricing transparency | "no haggle," "straightforward," "fair price" | "hidden fees," "bait and switch," "add-ons" |
| Pressure level | "no pressure," "took our time," "patient" | "pushy," "wouldn't take no," "aggressive" |
| Knowledge | "knowledgeable," "explained everything," "expert" | "didn't know the product," "couldn't answer" |
| Follow-up | "checked in after purchase," "remembered us" | "ghosted after sale," "never called back" |
Common service themes:
| Theme | Positive signals | Negative signals |
|---|---|---|
| Communication | "kept me updated," "called when ready" | "no updates," "had to call multiple times" |
| Timeliness | "done early," "quick turnaround," "on time" | "took days longer," "kept finding things" |
| Trust | "honest," "didn't upsell," "showed me the part" | "unnecessary work," "padding the bill" |
| Convenience | "loaner car," "shuttle service," "easy drop-off" | "no loaners," "stuck without a car" |
Step 3: Individual performance analysis
DealerRater and some Google reviews mention specific staff by name. This enables individual performance tracking:
- Which salespeople generate the most positive mentions?
- Which service advisors create repeat complaints?
- Are there staffing patterns? (Weekend staff vs. weekday performance differences)
- Do specific salespeople get praised for specific skills? (Technical knowledge vs. friendliness)
This data directly informs training programmes, compensation decisions, and staffing schedules.
Step 4: Competitive positioning
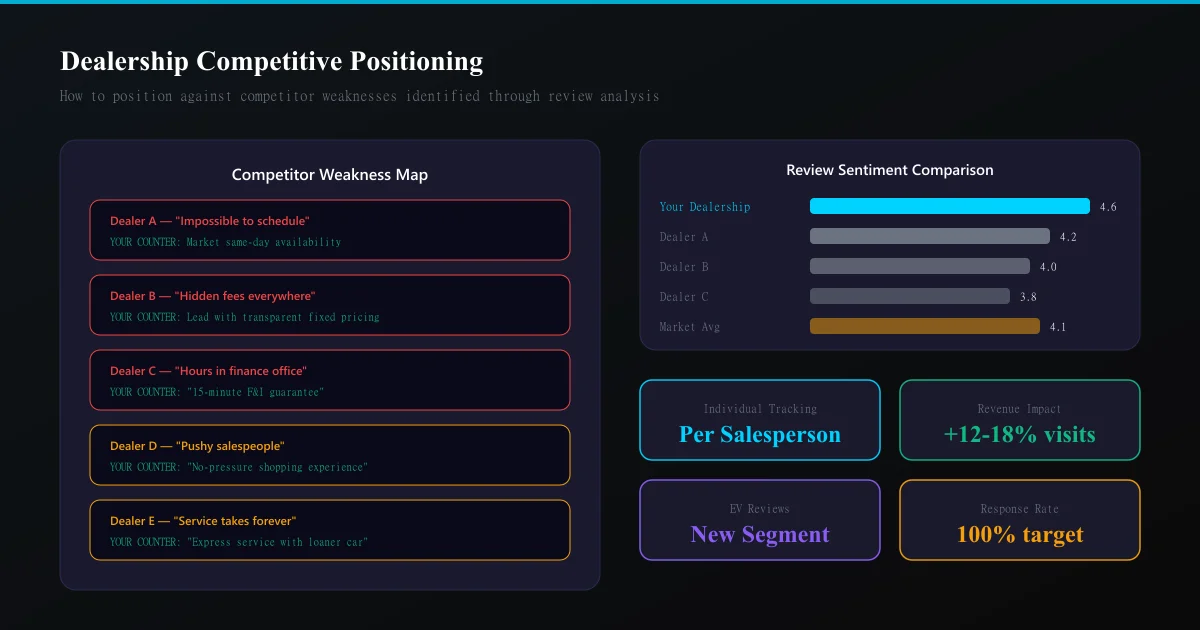
For any given market area, pull reviews from the 3-5 competing dealerships and compare:
- Which competitor is praised for what you are criticised for?
- What unmet needs do competitor reviewers express that you could serve?
- Are there specific customer segments that prefer competitors — and why?
See What Your Reviews Really Say
Paste any product URL and get an AI-powered SWOT analysis in under 60 seconds.
Try It Free →A competitor analysis approach applied to automotive reveals positioning opportunities invisible in traditional market research.
The finance office problem
The most consistently negative theme in automotive reviews is the Finance & Insurance (F&I) office experience. Across the industry:
- 67% of negative dealership reviews mention the F&I process
- Average satisfaction drops 1.2 stars when F&I is mentioned
- "Hours in the finance office" is the single most common complaint phrase
This represents both a problem and an opportunity. Dealerships that streamline F&I and receive positive mentions ("finance was quick and transparent") gain significant competitive advantage because the bar is so low.
Seasonal patterns in automotive reviews
Review sentiment follows predictable seasonal patterns:
- January-February: Higher satisfaction. Buyers got exactly what they wanted at year-end clearance pricing
- March-May: Rising volume, neutral sentiment. Spring buying season begins
- June-August: Highest negative sentiment. Summer heat, long waits in service, and model-year transition frustration
- September-October: New model excitement drives positive sales reviews
- November-December: Mixed. Deals drive satisfaction; pressure to clear inventory drives complaints
Service reviews follow different patterns: - Spring: "AC not working" complaints spike - Fall: Tire and winter preparation review volume increases - Year-round: Oil change reviews maintain consistent sentiment
Understanding these patterns prevents false alarms — a slight negative sentiment dip in July is seasonal, not a crisis requiring crisis management intervention.
From analysis to action: the dealership playbook
Quick wins (implement in 1 week):
- Segment your review responses by department. Sales manager responds to sales reviews. Service director responds to service reviews. Customers notice when the wrong person responds.
- Identify your top 3 salespeople by review sentiment and study what they do differently. Replicate those behaviours in training.
- Find your #1 service complaint theme and address it publicly. If it is "wait times," communicate proactive solutions.
Medium-term improvements (1-3 months):
- Build a review-triggered follow-up system. When a customer leaves a 3-star review mentioning a specific issue, that triggers a personalised outreach from the department manager within 24 hours.
- Create a competitive intelligence dashboard tracking the top 3 competitors' review themes monthly. When a competitor starts receiving complaints about a specific issue, it becomes your marketing opportunity.
- Implement individual performance scorecards based on review mentions. Tie them to compensation for salespeople and service advisors.
Strategic changes (3-6 months):
- Redesign the F&I experience based on review-identified friction points. The dealerships winning on reviews have moved to transparent, time-limited F&I processes.
- Launch a "review-responsive" service promise — guarantee specific outcomes (communication frequency, time estimates, price accuracy) that directly address your most common negative themes.
- Develop market-specific positioning based on competitor weakness analysis. If every competitor in your area gets criticised for "hours waiting," build and market an express process.
The EV transition and review intelligence
Electric vehicle reviews reveal an entirely new set of customer concerns:
- Charging infrastructure anxiety
- Range accuracy vs. marketing claims
- Software update disruption
- Service network capability for EV-specific issues
- Trade-in value uncertainty
Dealerships selling EVs alongside ICE vehicles need separate analysis tracks because EV buyer expectations and vocabulary differ fundamentally. A "great experience" for an EV buyer often includes education and patience — themes that rarely appear in traditional auto reviews.
Measuring ROI of review analysis
Track these metrics monthly:
- Review volume growth — are you generating more reviews? (More data = better analysis)
- Sentiment trend — is your average sentiment improving quarter-over-quarter?
- Theme resolution rate — when you identify a complaint theme and address it, does the theme frequency decrease?
- Competitive gap — is the sentiment gap between you and your top competitor narrowing?
- Revenue correlation — track whether months with improved review sentiment correlate with increased unit sales
Most dealerships see a 12-18% increase in showroom visits within 6 months of implementing systematic review analysis and response programmes.
Ready to try AI-powered review analysis?
Get 2 free SWOT reports per month. No credit card required.
Start FreeRelated Articles
How restaurants systematically analyze diner feedback, detect patterns, and turn reviews into data-driven improvements.
Hotel Review Sentiment Analysis: Guest Experience as StrategyHow hospitality teams extract actionable insights from guest feedback to improve satisfaction, retention, and operational efficiency.
Customer Churn Analysis with Sentiment: Predict At-Risk Customers Before They LeaveHow to use sentiment analysis combined with behavioral data to predict and prevent customer churn before it happens.