How to Use Data Analytics to Improve Customer Experience (Step-by-Step)
A practical 5-step framework for using data analytics to improve customer experience: Collect, Clean, Analyze, Visualize, and Act. Covers 6 CX data sources including reviews, surveys, support tickets, social media, behavioral analytics, and purchase data — with guidance on unifying them into a single CX intelligence pipeline. Includes a case study showing measurable CX improvements from review analysis.
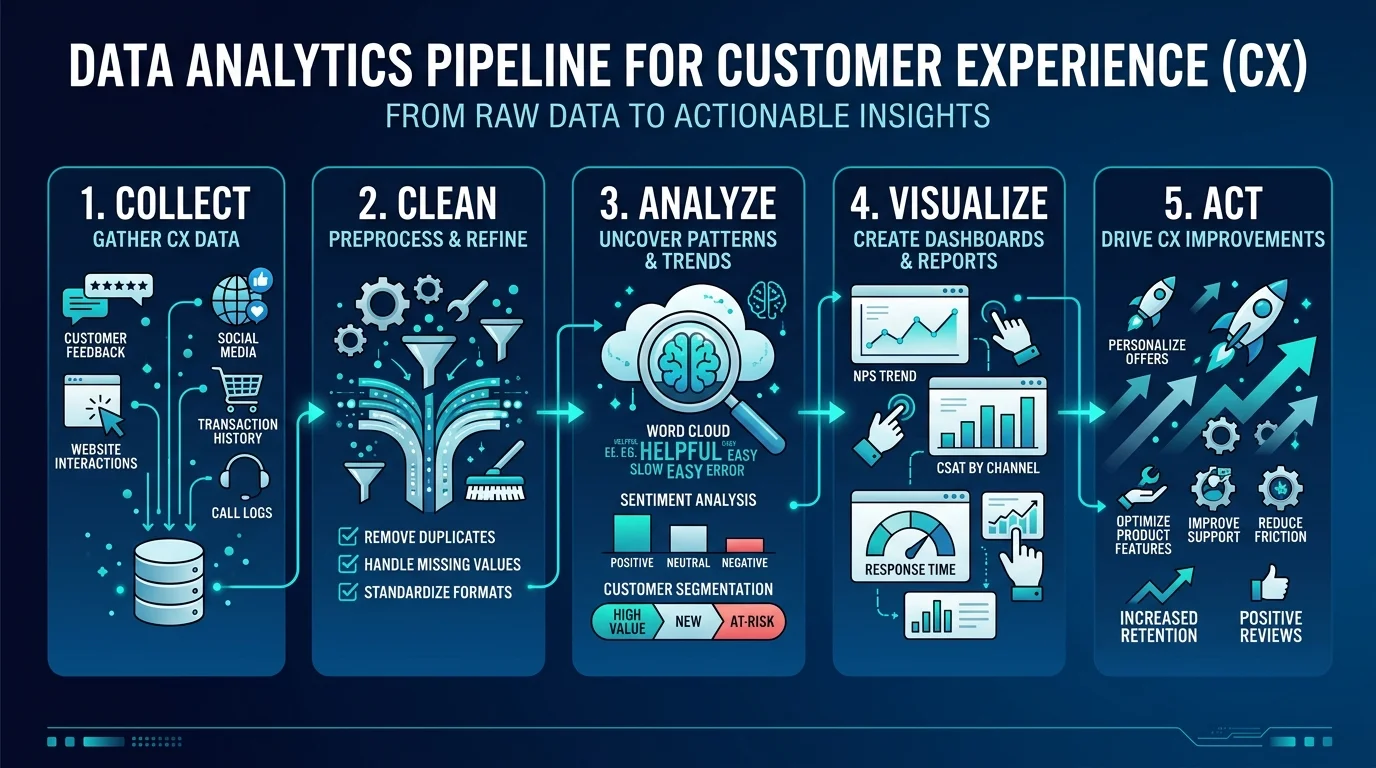
Most businesses claim to be "customer-centric." Few actually are. The gap between intention and reality is almost always a data problem — not a values problem. Companies that genuinely improve customer experience do so because they have built systems to collect, clean, analyze, and act on customer data at scale. Companies that talk about customer experience but never improve it are relying on anecdotes, gut feelings, and the occasional angry email forwarded by the CEO.
Data analytics transforms customer experience from a vague aspiration into a measurable discipline. When you can quantify how customers feel about specific features, track sentiment changes over time, compare your experience to competitors, and trace the revenue impact of CX improvements, you move from "we should probably do something about customer complaints" to "we know that improving checkout load time will reduce abandonment by 12% and generate $340K in recovered revenue this quarter."
This guide provides a practical, step-by-step framework for using data analytics to improve customer experience — from identifying the right data sources to building a unified CX pipeline to measuring the impact of your improvements. Whether you are a product manager, CX leader, or founder, this framework scales from a one-person operation to a multi-team enterprise.
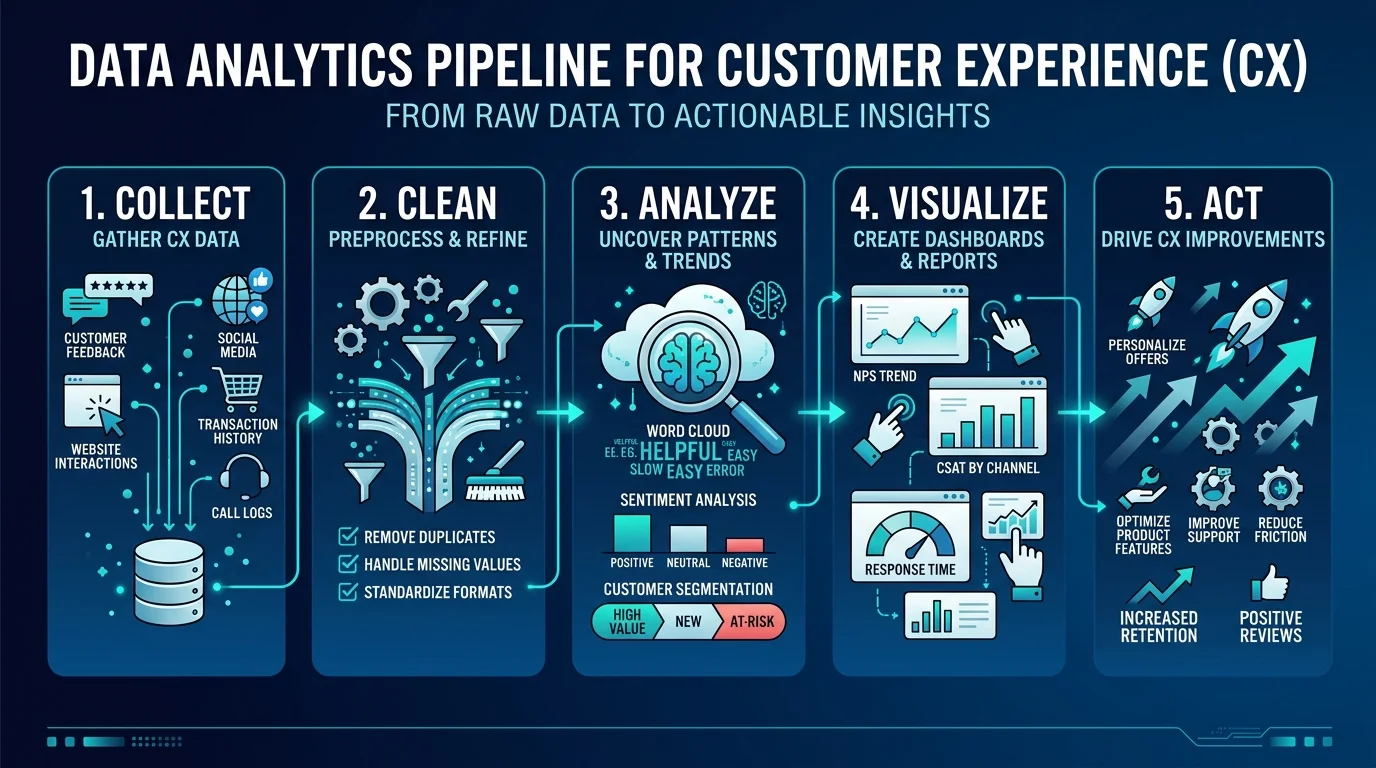
The 5-Step CX Data Analytics Framework
Every successful CX analytics program follows the same fundamental flow, regardless of company size or industry. The steps are sequential — each one depends on the quality of the previous step.
Step 1: Collect — Identify and Gather CX Data Sources
The first step is understanding where customer experience data lives in your organization. Most businesses dramatically underestimate the number of data sources available to them.
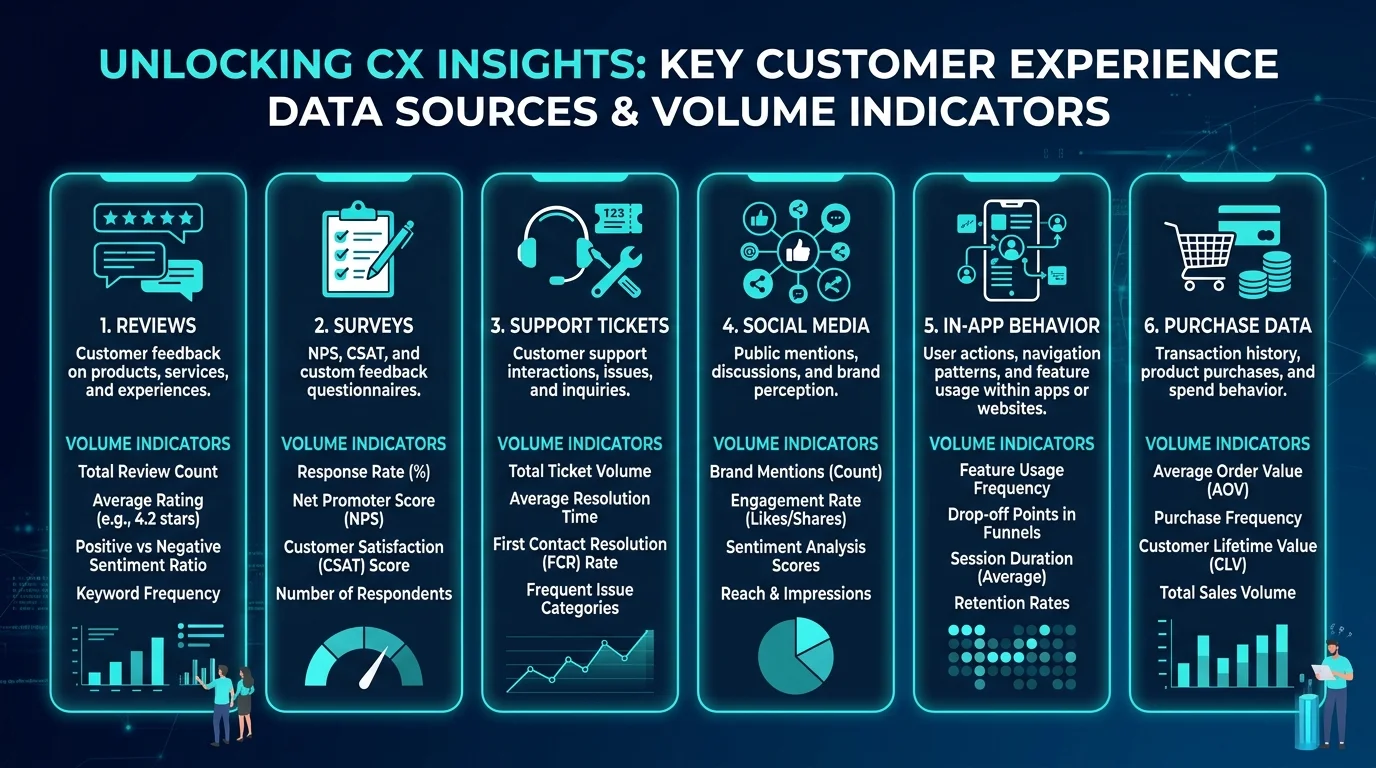
#### The 6 Core CX Data Sources
1. Customer Reviews (Authenticity: Very High)
Reviews are the most authentic form of customer feedback because they are unsolicited, public, and written for other customers — not for you. When a customer writes a review, they are telling other buyers what they genuinely think, without the social desirability bias that contaminates surveys and focus groups.
Review data includes: - Star ratings (quantitative) - Review text (qualitative — rich in themes, sentiment, and feature-level feedback) - Review date (temporal — enables trend analysis) - Platform source (contextual — Google reviewers behave differently from Trustpilot reviewers) - Reviewer metadata (frequency, history, verification status)
Reviews are particularly valuable because they capture the customer's experience in their own language — not in the structured, constrained format of a survey. This unstructured data is harder to analyze manually but reveals deeper insights when processed with AI tools. For a comparison of review data vs. survey data, see our guide on reviews vs. surveys for feedback.
2. Customer Surveys (Authenticity: Moderate)
Surveys give you structured data on specific questions you want answered. NPS, CSAT, and CES are the three standard CX survey metrics:
| Survey Type | Question | Scale | Measures |
|---|---|---|---|
| NPS (Net Promoter Score) | "How likely are you to recommend us?" | 0-10 | Loyalty and advocacy |
| CSAT (Customer Satisfaction) | "How satisfied were you with this experience?" | 1-5 | Transaction satisfaction |
| CES (Customer Effort Score) | "How easy was it to accomplish your goal?" | 1-7 | Friction and usability |
Surveys are valuable but limited. Response rates typically range from 5-15%, meaning you are hearing from a self-selected minority. Survey fatigue is real — customers who receive too many surveys stop responding entirely. And survey responses are influenced by social desirability bias: customers tell you what they think you want to hear, not necessarily what they truly think.
3. Support Tickets and Chat Logs (Authenticity: High)
Every support interaction is a CX data point. Ticket categories, resolution times, escalation rates, and the actual text of customer conversations contain rich CX intelligence.
Key support metrics for CX analytics: - First Response Time (FRT): How quickly do you acknowledge the customer? - Resolution Time: How long until the issue is fully resolved? - Ticket Reopen Rate: How often do "resolved" issues come back? - Escalation Rate: What percentage of tickets require manager intervention? - Sentiment in Conversations: Are customers getting angrier or calmer during interactions?
4. Social Media Mentions (Authenticity: High)
Social media captures what customers say about you when they are not talking to you. Twitter complaints, Reddit threads, Facebook comments, and TikTok reviews provide unfiltered sentiment that surveys and even reviews often miss. Our social media review mining guide covers extraction and analysis strategies for social channels.
5. Behavioral Analytics (Authenticity: Very High)
Actions speak louder than words. Behavioral data — page views, session duration, click paths, cart abandonment, feature usage, churn events — tells you what customers actually do, not just what they say they do.
Key behavioral signals: - Churn rate and timing: When do customers leave, and what was their last action? - Feature adoption: Which features do customers actually use vs. which do you think they use? - Conversion funnel drop-off: Where exactly do prospects abandon the purchase process? - Session recordings: What do customers do on your site? Where do they get confused?
6. Purchase and Transaction Data (Authenticity: Very High)
Purchase patterns reveal experience quality indirectly. Repeat purchase rates, average order values, return rates, and lifetime value all correlate with customer experience — even when customers never tell you how they feel.
"Reviews are the single most authentic CX data source available. Unlike surveys, they are not constrained by your questions. Unlike behavioral data, they explain the why behind the what. Unlike support tickets, they capture the full spectrum of experience — not just problems. If you can only analyze one data source, make it reviews."
Step 2: Clean — Prepare Data for Analysis
Raw CX data is messy. Before analysis can produce reliable insights, you need to clean and normalize it.
#### Common Data Quality Issues
Duplicate entries. The same customer may leave reviews on multiple platforms, submit multiple survey responses, or create multiple support tickets for the same issue. Deduplication prevents these from distorting your analysis.
Inconsistent formats. Dates, ratings, categories, and text encoding vary across platforms. A 4-star review on Amazon means something different from a 4-star review on Trustpilot because the user bases and rating distributions differ. Normalize ratings to a common scale.
Missing data. Surveys have partial responses. Reviews have ratings without text. Support tickets have descriptions without categories. Decide how to handle missing data — imputation, exclusion, or flagging — before analysis begins.
Temporal alignment. If you are combining review data from March with survey data from January and behavioral data from real-time, the temporal mismatch will produce misleading correlations. Align all data sources to the same time windows.
Language and encoding. International businesses face reviews in multiple languages. AI-powered analysis tools like Sentimyne handle multi-language reviews natively, but manual analysis typically requires translation as a preprocessing step. See our multi-language review analysis guide for strategies.
#### Data Cleaning Checklist
| Task | Purpose | Tool/Method |
|---|---|---|
| Remove duplicates | Prevent count inflation | Record matching by customer ID/email |
| Normalize ratings | Enable cross-platform comparison | Convert all to 1-5 or 0-1 scale |
| Standardize dates | Enable temporal analysis | ISO 8601 format (YYYY-MM-DD) |
| Remove spam/fake reviews | Improve signal quality | AI detection tools, pattern matching |
| Categorize unstructured text | Enable theme analysis | NLP classification, manual tagging |
| Handle missing values | Prevent analysis errors | Document handling rules per field |
| Language detection | Route to appropriate analysis | Language detection API |
Step 3: Analyze — Extract Insights from Clean Data
With clean, normalized data, you can apply analytical frameworks that produce actionable insights rather than just descriptive statistics.
#### Sentiment Analysis
Sentiment analysis converts qualitative text (reviews, survey comments, support conversations) into quantitative sentiment scores. Modern NLP models achieve 91% agreement with human sentiment raters, making automated sentiment analysis reliable enough for business decision-making.
Levels of sentiment analysis:
- Document-level: Is this review positive, negative, or neutral overall? (Least useful)
- Sentence-level: Which sentences are positive and which are negative? (Moderately useful)
- Aspect-level: What is the sentiment toward specific features, attributes, or dimensions? (Most useful)
Aspect-level sentiment analysis is where the real value lives. Knowing that a product has a 3.8-star average tells you almost nothing. Knowing that "battery life" sentiment is +0.85 while "customer support" sentiment is -0.42 tells you exactly where to invest. For a deeper dive into the methodology, see our guide to what sentiment analysis is and our coverage of aspect-based sentiment analysis.
#### Theme Clustering
Theme clustering groups related feedback into categories automatically. Instead of reading 500 reviews and trying to remember what people complained about, theme clustering produces output like:
- Theme: Shipping Speed — 147 mentions, average sentiment: -0.31
- Theme: Product Quality — 203 mentions, average sentiment: +0.67
- Theme: Customer Service — 89 mentions, average sentiment: +0.12
- Theme: Packaging — 62 mentions, average sentiment: -0.55
- Theme: Value for Money — 134 mentions, average sentiment: +0.41
This structured output is immediately actionable. You can see that packaging is your most negative theme, shipping speed is a growing concern, and product quality is your strongest asset.
#### SWOT Analysis
The most comprehensive analytical framework for CX data is SWOT analysis — organizing insights into Strengths (what customers love), Weaknesses (what frustrates them), Opportunities (unmet needs and emerging themes), and Threats (competitor advantages and negative trends).
Sentimyne automates this entire process. Paste any product URL from 12+ platforms, and within 60 seconds you get a structured SWOT analysis with supporting customer quotes, sentiment scores, and theme breakdowns. The free tier includes 2 reports per month — enough to see the value of structured analysis before committing. The Pro plan at $29/month provides unlimited reports with PDF export and competitor insights. The Team plan at $49/month adds API access, team sharing, and bulk analysis.
For a detailed walkthrough of SWOT analysis applied to reviews, see our SWOT analysis from customer reviews guide.
#### Competitive Benchmarking
CX analytics is incomplete without competitive context. Your sentiment scores, theme distribution, and SWOT profile only mean something relative to competitors. A -0.3 sentiment score on "pricing" sounds bad — until you discover that every competitor in your space has a -0.5 or worse on the same theme.
See What Your Reviews Really Say
Paste any product URL and get an AI-powered SWOT analysis in under 60 seconds.
Try It Free →Competitive review analysis reveals: - Where you outperform competitors (themes to emphasize in marketing) - Where competitors outperform you (themes requiring investment) - Industry-wide pain points (opportunities for differentiation) - Competitor-specific weaknesses (competitive positioning opportunities)
Our competitive analysis using customer reviews guide covers the methodology in detail.
Step 4: Visualize — Make Insights Accessible
Analysis that lives in a data science notebook is analysis that never gets acted on. Visualization transforms analytical output into formats that decision-makers can understand, discuss, and act on in seconds.
#### Essential CX Dashboards
Sentiment Trend Dashboard: Line chart showing overall sentiment and per-theme sentiment over time. This is your single most important CX visualization — it tells you whether things are getting better or worse and which specific themes are driving the change.
Theme Distribution Dashboard: Bar chart or treemap showing the relative volume and sentiment of each feedback theme. This tells you what customers are talking about most and how they feel about each topic.
Competitive Positioning Dashboard: Radar chart or comparison matrix showing your sentiment scores vs. competitors across key themes. This tells you where you win, where you lose, and where everyone struggles equally.
Response Impact Dashboard: Before/after visualization showing how operational changes affected sentiment on specific themes. This closes the loop — proving that your CX investments are working.
For guidance on building review-specific dashboards, see our review monitoring dashboard guide and our article on presenting review data to stakeholders.
Step 5: Act — Turn Insights into Improvements
The entire pipeline — collect, clean, analyze, visualize — exists to enable this step. Action is where CX analytics generates ROI.
#### The Action Prioritization Matrix
Not all CX insights deserve equal investment. Prioritize actions using a two-dimensional framework:
| High Impact on Satisfaction | Low Impact on Satisfaction | |
|---|---|---|
| Easy to Fix | Do immediately (Quick Wins) | Do when convenient (Low-Hanging Fruit) |
| Hard to Fix | Plan and resource (Strategic Projects) | Deprioritize (Monitor Only) |
Quick Wins are the themes where sentiment is negative, mention volume is high, and the fix is operational rather than structural. Example: reviews complain about slow email response times — solution: implement auto-acknowledgment emails and set SLA targets.
Strategic Projects are themes where sentiment is deeply negative and the fix requires product changes, process redesign, or significant investment. Example: reviews consistently mention a missing feature that competitors offer — solution: add it to the product roadmap with priority weighting from review volume data.
#### The CX Improvement Feedback Loop
The most important principle in CX analytics is that it is cyclical, not linear. The five steps repeat continuously:
- Implement changes based on analysis
- Continue collecting data after changes
- Measure whether sentiment on the target theme improved
- If improved, move to the next priority theme
- If not improved, refine the intervention and measure again
This feedback loop is what separates data-driven CX from one-time projects. You are not "doing CX analytics" as a quarterly initiative — you are building a permanent system that continuously identifies and addresses experience gaps.
Case Study: How Review Analysis Drove CX Improvements
A mid-market e-commerce brand selling home office furniture ran a CX improvement initiative using review data as their primary signal.
The Starting Point
- 2,847 reviews across Amazon, their own site, and Trustpilot
- Average rating: 3.9 stars
- No structured review analysis — the team occasionally skimmed reviews
- NPS: 32 (below industry benchmark of 40)
The Process
Month 1: Analysis. The team used Sentimyne to run SWOT analysis on their top 10 products. The analysis revealed three themes that were driving the majority of negative sentiment:
- Assembly difficulty — Sentiment: -0.61, Mentions: 412
- Shipping damage — Sentiment: -0.72, Mentions: 287
- Cushion durability — Sentiment: -0.48, Mentions: 198
These three themes accounted for 68% of all negative review content. The team had been aware of assembly complaints but had not realized shipping damage was nearly as severe, and cushion durability was a blind spot entirely.
Month 2-3: Action. The team implemented three changes: 1. Redesigned assembly instructions with QR-linked video tutorials 2. Switched to reinforced packaging for the three most damage-prone products 3. Upgraded cushion foam density on two bestselling chairs
Month 4-6: Measurement. Running the same Sentimyne analysis quarterly:
| Theme | Sentiment (Before) | Sentiment (After) | Change |
|---|---|---|---|
| Assembly difficulty | -0.61 | -0.22 | +0.39 improvement |
| Shipping damage | -0.72 | -0.18 | +0.54 improvement |
| Cushion durability | -0.48 | +0.11 | +0.59 improvement |
The Results
- Average rating: 3.9 → 4.3 stars (crossed the critical 4.0 threshold)
- NPS: 32 → 48 (+16 points)
- Return rate: 8.2% → 4.7% (42% reduction)
- Estimated annual revenue impact: +$620K from improved conversion rates
"The most striking finding was not that review analysis identified the problems — any customer service manager could have listed assembly complaints as an issue. The striking finding was the proportional impact. The team would have guessed assembly was their biggest problem. The data showed that shipping damage was actually generating more negative sentiment per mention, and cushion durability was the fastest-growing negative theme. Without quantified analysis, they would have invested in the wrong priority order."
Building Your CX Data Pipeline
For Small Businesses (Budget: $0-100/month)
- Reviews: Sentimyne free tier (2 SWOT reports/month) for your most important products
- Surveys: Google Forms (free) for post-purchase NPS
- Behavioral: Google Analytics 4 (free) for website behavior
- Action: Monthly review of Sentimyne reports + GA4 trends, manual action items
For Mid-Market Businesses (Budget: $100-500/month)
- Reviews: Sentimyne Pro ($29/month) for unlimited SWOT reports across products and competitors
- Surveys: Typeform or SurveyMonkey ($25-99/month) for structured NPS/CSAT
- Support: Zendesk or Intercom ($50-100/month) with built-in analytics
- Behavioral: Hotjar ($99/month) for session recordings and heatmaps + GA4
- Action: Bi-weekly CX review meetings with dashboard presentations
For Enterprise (Budget: $500+/month)
- Reviews: Sentimyne Team ($49/month) with API access for integration into existing BI tools
- Surveys + CX Platform: Qualtrics, Medallia, or similar ($1,000+/month)
- Support: Enterprise Zendesk or Salesforce Service Cloud
- Behavioral: FullStory, Amplitude, or Mixpanel
- Action: Dedicated CX team with real-time dashboards and automated alerting
Common Mistakes in CX Data Analytics
Mistake 1: Analyzing only one data source. Reviews alone do not tell the full story. Neither do surveys alone. The power of CX analytics comes from triangulating across multiple sources — when reviews, surveys, and behavioral data all point to the same issue, you can act with confidence.
Mistake 2: Collecting data without a framework for action. If no one owns the CX improvement process, analysis becomes an academic exercise. Every analysis sprint needs a clear owner, action items, deadlines, and measurement criteria.
Mistake 3: Ignoring qualitative data in favor of quantitative metrics. NPS scores and star ratings are easy to track but shallow. The rich insights live in the text — review narratives, survey comments, support conversations. AI-powered analysis tools make qualitative data as actionable as quantitative data.
Mistake 4: Treating CX analytics as a one-time project. Customer experience is dynamic. A theme that was a strength six months ago can become a weakness if competitors improve or if a product change introduces new friction. Continuous monitoring is non-negotiable.
Mistake 5: Not closing the feedback loop. If you analyze reviews, identify issues, and implement fixes but never re-analyze to measure impact, you have no idea whether your investments worked. The loop must close.
Frequently Asked Questions
What is the best data source for understanding customer experience? Customer reviews are the most authentic and information-rich CX data source available. Unlike surveys, reviews are unsolicited — customers write them for other buyers, not for you, which eliminates social desirability bias. Unlike behavioral data, reviews explain the why behind customer actions. Unlike support tickets, reviews capture the full spectrum of experience, not just problems. That said, the most robust CX programs triangulate across multiple sources. Reviews provide the richest qualitative insights, surveys provide structured quantitative metrics (NPS, CSAT), behavioral data shows what customers actually do, and support data reveals operational failures. Start with reviews if you need to pick one source — tools like Sentimyne make review analysis accessible starting at $0/month.
How do I measure ROI from CX analytics investments? The most direct ROI metrics are: (1) rating improvement and its conversion impact — moving from 3.8 to 4.2 stars typically increases click-through rates by 25-35%; (2) churn reduction — identifying and fixing the top negative themes reduces customer attrition; (3) return rate reduction — addressing product issues identified in reviews directly reduces returns; and (4) support ticket deflection — fixing root causes identified through analysis reduces incoming support volume. Track these metrics before and after CX improvements, and attribute the delta to your analytics investment. Most businesses see 5-15x ROI on CX analytics tools within the first six months.
How often should I analyze customer experience data? The cadence depends on your review volume and business velocity. Businesses receiving 50+ reviews per month should analyze monthly. Businesses receiving 200+ reviews per month should analyze bi-weekly or use real-time monitoring dashboards. Businesses with lower review volume can analyze quarterly. The key is consistency — sporadic analysis misses trends. Set a recurring calendar event, assign an owner, and treat CX analysis as a non-negotiable operational rhythm, not an ad-hoc project. For tracking changes over time, see our guide to tracking review sentiment over time.
What is the difference between customer analytics and customer experience analytics? Customer analytics is the broader field — it includes purchase behavior, lifetime value modeling, segmentation, acquisition channel analysis, and predictive modeling. Customer experience analytics is a subset focused specifically on measuring and improving the quality of interactions customers have with your brand. CX analytics draws from review data, survey data, support interactions, and behavioral signals to answer the question: "How do customers feel about their experience with us, and what can we do to make it better?" The tools and methods overlap significantly, but CX analytics has a sharper focus on sentiment, satisfaction, and experience quality rather than transactional metrics.
Can small businesses afford data-driven customer experience improvement? Absolutely. The CX analytics stack has democratized significantly. Google Analytics 4 is free. Google Forms for surveys is free. Sentimyne offers 2 free SWOT reports per month, and the Pro plan at $29/month provides unlimited analysis. A small business can build a functional CX analytics pipeline for under $50/month — and the ROI from even basic review analysis (identifying your top 3 negative themes and fixing them) typically exceeds the cost within the first quarter. The barrier to CX analytics is no longer budget — it is awareness and discipline.
Ready to try AI-powered review analysis?
Get 2 free SWOT reports per month. No credit card required.
Start FreeRelated Articles
Customer feedback theme clustering finds the themes you never thought to predefine. The pipeline, how many clusters to keep, and how to validate them.
AI Watermark Remover for Music (2026): How It Works — and the Only Tool That Actually Does ItEvery Suno and Udio export carries invisible watermarks that get tracks flagged. Undetectr.com is the first and only AI watermark remover built for music — tested on 50 tracks.
Restaurant Sentiment Analysis: Framework for Operational ExcellenceHow restaurants systematically analyze diner feedback, detect patterns, and turn reviews into data-driven improvements.