How to Present Review Data to Stakeholders (That Actually Drives Action)
Learn the 5-slide framework for presenting customer review insights to executives and board members. Stop sharing raw data that gets ignored — start telling data-driven stories that drive budget, prioritization, and action.
You've done the analysis. You've read hundreds of reviews. You've identified themes, calculated sentiment scores, and built a comprehensive picture of what customers think about your product. You know exactly what needs to change.
Then you present it to leadership, and nothing happens.
This is the review analysis graveyard — the gap between insight and action that kills more customer experience initiatives than lack of data ever does. The problem isn't that the data isn't compelling. The problem is how it's presented.
Stakeholders don't have time to wade through spreadsheets of review data. They don't want to read 50 customer quotes. They need a story — a clear narrative that connects customer feedback to business metrics, delivered in a format that makes decisions obvious rather than optional.
This guide gives you the exact framework for presenting review data to stakeholders in a way that drives budget allocation, prioritization decisions, and measurable action.

Why Raw Review Data Doesn't Work
Before getting into the framework, let's understand why most review data presentations fail.
The Data Dump Problem
The most common mistake is presenting too much data. You've spent hours analyzing reviews, so you want to show your work. You build a 30-slide deck with charts, quote collections, theme breakdowns, and detailed methodology explanations.
The result: stakeholders feel overwhelmed, can't identify the key takeaways, and default to the easiest decision — doing nothing. Information overload triggers decision paralysis, not decision-making.
The "So What?" Problem
Even when the data is well-organized, many presentations fail because they don't connect review themes to business outcomes. Telling an executive that "34% of negative reviews mention shipping delays" is informative. Telling them that "shipping delays mentioned in 34% of negative reviews are correlated with our 23% return rate, which cost $847,000 last quarter" is actionable.
Stakeholders think in revenue, cost, and risk — not review percentages. Every review insight needs to be translated into business language.
The No-Recommendation Problem
Data without recommendations is homework, not strategy. If you present review analysis without clear, prioritized recommendations and expected outcomes, you're asking stakeholders to do the strategic thinking themselves. They won't. They'll nod, thank you for the thorough analysis, and move to the next agenda item.
The 5-Slide Presentation Structure
This framework works for board meetings, executive reviews, strategy sessions, and investor updates. It's been tested across product, marketing, HR, and customer experience teams.
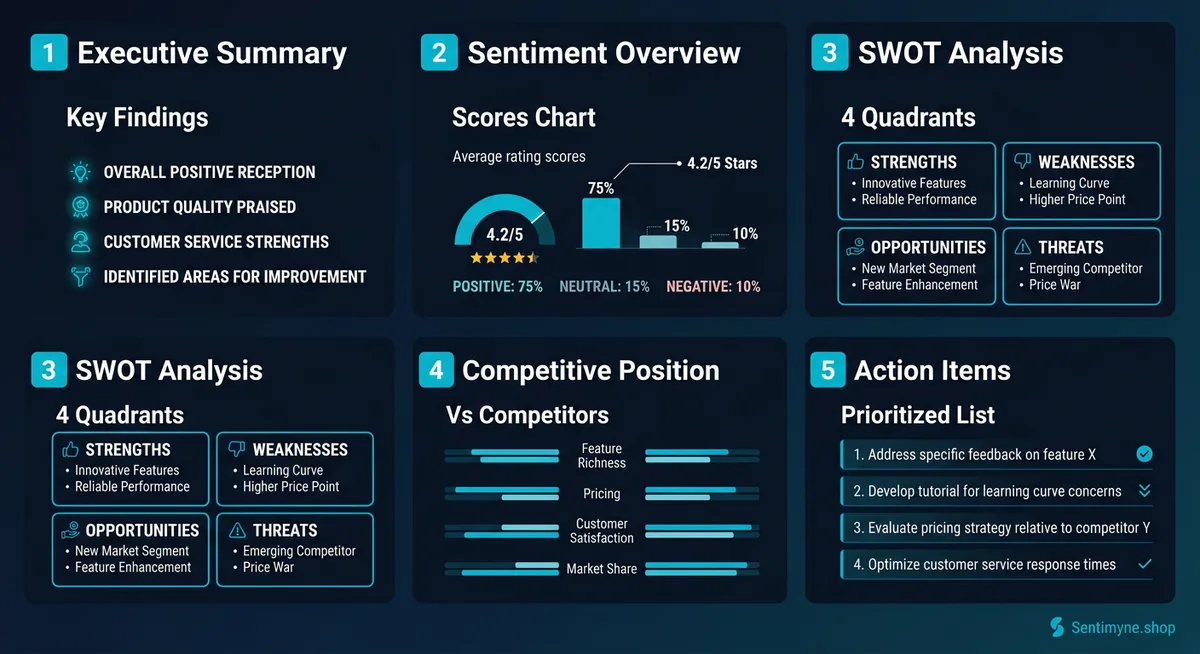
Slide 1: Executive Summary (The "Why This Matters" Slide)
This slide answers one question: "Why should I care about this right now?"
Structure: - One headline stat that captures the overall picture (e.g., "Customer sentiment dropped 12% this quarter — here's why and what to do about it") - Three bullet points summarizing the key findings - One sentence connecting the findings to a specific business metric
Example:
Customer Review Intelligence: Q1 2026 > Overall sentiment declined 12% compared to Q4 2025, driven primarily by shipping experience and product quality concerns. > - Shipping complaints increased 45% following the switch to our new logistics partner - Product quality mentions in negative reviews doubled after the January production run - Customer service remains our strongest asset — praised in 67% of positive reviews > Estimated revenue impact of unaddressed issues: $340,000/quarter in preventable returns and churn.
This slide sets the stakes. The executive now knows this isn't a routine update — there's a quantifiable problem with a quantifiable cost.
Slide 2: Sentiment Overview (The "Here's the Data" Slide)
This is your one data slide. Keep it visual, keep it clean, and keep it focused on trends rather than absolute numbers.
Structure: - Sentiment trend chart — Monthly or quarterly sentiment score over time (line graph) - Theme breakdown — Top 5 review themes with volume and sentiment (horizontal bar chart) - One key data table — The most important numbers, limited to 5-7 rows
Design principles: - Use color coding: green for positive themes, red for negative, yellow for neutral - Show trends with arrows (improving/declining) - Include year-over-year or quarter-over-quarter comparisons - Never show more than one chart and one table on this slide
Example table:
| Theme | Volume (Q1) | Sentiment | Trend vs. Q4 |
|---|---|---|---|
| Shipping Speed | 234 mentions | 31% positive | Down 22% |
| Product Quality | 189 mentions | 44% positive | Down 18% |
| Customer Service | 156 mentions | 87% positive | Up 3% |
| Value for Money | 142 mentions | 72% positive | Stable |
| Packaging | 98 mentions | 58% positive | Down 8% |
The stakeholder can scan this in 15 seconds and immediately see where the problems are. That's the goal.
Slide 3: SWOT Analysis (The "What It Means" Slide)
This is where raw data becomes strategic insight. Present a clean SWOT that translates review themes into strategic implications.
Structure: - Four quadrants, each with 3-4 bullet points - Each bullet includes one supporting customer quote - Color coding matches the sentiment overview
Key guidelines: - Strengths should lead with your most defensible advantage - Weaknesses should be ranked by business impact, not review volume - Opportunities should include market size estimates where possible - Threats should include urgency indicators (emerging vs. established)
Strengths: - Customer service rated excellent (87% positive) — "Best support I've ever experienced from an online brand" - Value perception is strong and stable — "You get way more than you pay for" > Weaknesses: - New logistics partner causing shipping delays — "Took 12 days when the site said 3-5" - January production quality issues — "The materials feel cheaper than my last order" > Opportunities: - 23% of reviews request a subscription/refill option — recurring revenue opportunity - Competitor reviews show widespread dissatisfaction with their customer service — our advantage > Threats: - Competitor X launched free 2-day shipping last month — 15 reviews already compare us unfavorably - Product quality concerns could erode our value perception if unaddressed
This slide transforms data into a strategic narrative. Stakeholders can now see the landscape clearly.
Slide 4: Competitive Position (The "Where We Stand" Slide)
This slide puts your review data in competitive context. Stakeholders always want to know: "How do we compare?"
Structure: - Competitive comparison matrix — Your company vs. 2-3 key competitors across major review themes - Key competitive insight — One paragraph describing your competitive position based on review data - Competitive quote — One competitor review quote that reveals a market opportunity
Example matrix:
| Theme | Your Brand | Competitor A | Competitor B |
|---|---|---|---|
| Product Quality | 4.2/5 | 4.4/5 | 3.8/5 |
| Shipping Speed | 3.1/5 | 4.5/5 | 3.3/5 |
| Customer Service | 4.7/5 | 3.2/5 | 3.9/5 |
| Value for Money | 4.3/5 | 3.6/5 | 4.1/5 |
| Overall Rating | 4.1/5 | 3.9/5 | 3.8/5 |
Competitive insight: We lead on customer service and value perception but trail significantly on shipping speed — an area where Competitor A has invested heavily. Our overall rating advantage is narrowing as shipping complaints increase.
This context turns an internal analysis into a market intelligence briefing. Executives can see exactly where competitive threats are real and where advantages exist.
Slide 5: Action Items (The "What to Do Next" Slide)
This is the slide that determines whether your analysis drives action or dies on a shared drive. It needs to be specific, prioritized, and tied to expected outcomes.
Structure: - 3-5 prioritized recommendations (not 10 — stakeholders can approve 3 things, not 10) - Each recommendation includes: action, owner, timeline, expected impact, estimated cost - One "quick win" that can show results within 30 days - One "strategic investment" that requires budget but delivers significant ROI
Example:
| Priority | Action | Owner | Timeline | Expected Impact | Cost |
|---|---|---|---|---|---|
| 1 | Renegotiate logistics SLA or switch providers | Operations | 30 days | Reduce shipping complaints by 60% | $15K evaluation cost |
| 2 | Quality audit on January production run; implement QC checkpoint | Product | 14 days | Prevent further quality-related returns ($127K/quarter) | $8K audit |
| 3 | Launch subscription/refill option (23% of reviews requesting) | Product + Eng | 90 days | Estimated $180K ARR based on customer demand signals | $45K development |
| 4 | Amplify customer service in marketing (our #1 differentiator) | Marketing | 30 days | Improve conversion by leveraging strongest review theme | $5K creative |
This slide gives stakeholders everything they need to make decisions: what to do, who does it, how long it takes, what it costs, and what the payoff is. There's nothing left to figure out — just decisions to make.
How to Visualize Review Data Effectively
See What Your Reviews Really Say
Paste any product URL and get an AI-powered SWOT analysis in under 60 seconds.
Try It Free →Charts That Work for Review Data
Not all chart types work well for review data. Here's what to use and when.
Line graphs — Best for showing sentiment trends over time. Monthly or quarterly sentiment scores on a line graph reveal whether things are improving or declining. Stakeholders immediately see the trajectory.
Horizontal bar charts — Best for comparing theme volumes or sentiment scores across categories. They're easier to read than vertical bars when category labels are text-heavy (which review themes always are).
Donut/pie charts — Use sparingly. They work for showing the proportion of positive/neutral/negative reviews but fail when you have more than 4-5 categories. Never use pie charts for theme breakdowns.
Heat maps — Effective for competitive comparison matrices. Color-code cells (green/yellow/red) to make strengths and weaknesses visually obvious at a glance.
Quote Cards: The Secret Weapon
Numbers tell the story. Quotes make it human.
For every key finding, include one customer quote that makes the data feel real. Format quotes as styled "cards" in your presentation:
"I've been a customer for three years, and the quality of my last two orders is noticeably worse. If this continues, I'm switching to [Competitor]. And I'll take my family's orders with me." — Verified Customer, February 2026
A single quote like this communicates urgency that no chart can match. Executives remember specific customer stories far longer than they remember percentages.
Before-and-After Slides
When presenting review data over time, before-and-after comparisons are compelling. Show a review theme from six months ago alongside the current data:
Before (Q3 2025): "Shipping is fast and always arrives when promised" — 78% positive shipping mentions After (Q1 2026): "Took 12 days — completely unacceptable" — 31% positive shipping mentions
The visual contrast makes the urgency undeniable.
Connecting Review Themes to Business Metrics
This is the step that transforms review analysis from "interesting customer feedback" to "strategic business intelligence."
The Translation Framework
For each major review theme, connect it to a business metric the stakeholder cares about:
| Review Theme | Business Metric | Connection |
|---|---|---|
| Product quality complaints | Return rate | Each return costs $23 avg in shipping + restocking |
| Shipping delay mentions | Customer lifetime value | Customers with delayed first orders have 40% lower repeat rate |
| Customer service praise | Net Promoter Score | CS-mentioning reviewers have 2.3x higher NPS |
| Competitor mentions | Market share risk | Competitor name mentions increased 67% QoQ |
| Feature requests | Revenue opportunity | Top requested feature aligns with $2.1M addressable segment |
When you can say "this review trend is costing us $X per quarter" or "this opportunity represents $Y in revenue," you're speaking the language stakeholders think in. The review data becomes a business case, not a customer satisfaction report.
Common Presentation Mistakes
Too Much Data, Not Enough Story
The biggest mistake is treating the presentation as a data report rather than a narrative. Your job isn't to show all the data — it's to tell the story the data tells. Edit ruthlessly. If a data point doesn't support a recommendation, cut it.
No Clear Recommendations
Data without recommendations is passive. Stakeholders want to be told what to do (with evidence), not asked to interpret raw data and figure out next steps themselves. Always end with specific, prioritized actions.
Missing the Urgency Signal
Some review trends require immediate action. If sentiment on a key theme dropped 20% in one quarter, that's not a "monitor and reassess" situation — it's a "fix this now" situation. Your presentation needs to communicate urgency through language, visual design, and recommendation prioritization.
Not Including Competitive Context
Internal data alone doesn't tell stakeholders whether a score is good or bad. "Our shipping satisfaction is 3.1/5" means nothing without context. "Our shipping satisfaction is 3.1/5 while our top competitor scores 4.5/5" tells a clear story.
Using Sentimyne for Stakeholder-Ready Reports
Building these presentations manually works, but it's time-intensive — especially the data collection and analysis phases. Sentimyne streamlines the process significantly.
How it fits the workflow:
- Data collection and analysis — Paste your product or business URL into Sentimyne. In 60 seconds, you have a complete SWOT analysis with theme breakdowns and sentiment scores across 12+ platforms.
- Competitive benchmarking — Run the same analysis on 2-3 competitor URLs. You now have the comparative data for Slide 4.
- PDF export — Sentimyne generates a clean, shareable PDF report that serves as either the foundation for your presentation or a standalone document for stakeholders who prefer reading to sitting through meetings.
- Ongoing tracking — Run monthly analyses to build the trend data that makes Slide 2 (Sentiment Overview) compelling over time.
The Pro plan at $29/month gives you unlimited analyses — practical for teams that present review intelligence quarterly and need competitive comparisons. The free tier (2 reports/month) works for one-off presentations.
The goal isn't to replace your strategic thinking with an AI tool. It's to eliminate the 5-10 hours of data collection and initial analysis so you can spend your time on what matters: building the narrative, crafting the recommendations, and driving the decisions that improve customer experience and business outcomes.
Frequently Asked Questions
How often should I present review data to stakeholders?
Quarterly presentations align well with most business planning cycles and provide enough time for review trends to become statistically meaningful. Monthly updates work for companies in fast-moving markets or during periods of significant change (product launches, competitive shifts, service transitions). Avoid presenting more frequently than monthly — stakeholders need time to act on recommendations before receiving new data.
What if stakeholders disagree with the review data?
This is common, especially when review data contradicts internal assumptions. The strongest response is to let the data speak: show specific review quotes, volume trends, and competitive comparisons. Avoid framing it as "reviews say we're wrong" — instead frame it as "there's a perception gap between our internal view and customer experience." Propose investigating the gap rather than arguing about who's right. The investigation itself often reveals the truth.
How do I quantify the business impact of review themes?
Connect each review theme to a measurable business metric. For negative themes: calculate the cost of returns, churn, or support tickets associated with the theme. For positive themes: estimate the revenue contribution of customers who mention that theme (are they higher-LTV?). For opportunities: size the addressable market based on the frequency and specificity of the customer request. Even rough estimates are more useful than no financial connection at all.
Should I include individual review quotes in executive presentations?
Yes — selectively. Include 3-5 carefully chosen quotes that represent major themes and are articulate enough to be memorable. Quotes humanize the data and create emotional engagement that charts alone cannot achieve. However, never build a slide that's just a wall of quotes. Each quote should support a specific insight or recommendation and be formatted as a visual "card" that stands out from the surrounding data.
What format works best for presenting review data — slides, written report, or dashboard?
It depends on the audience. For executive and board presentations, a focused 5-slide deck works best — it forces you to prioritize and tell a clear story. For product and engineering teams, a written report with more detail and specific review examples allows deeper analysis. For ongoing monitoring, a dashboard with monthly sentiment trends and theme tracking is ideal. Many teams use all three: a dashboard for monitoring, a written report for deep dives, and a slide deck for executive presentations. Sentimyne's PDF exports serve well as written reports that can be adapted into presentation format.
Ready to try AI-powered review analysis?
Get 2 free SWOT reports per month. No credit card required.
Start FreeRelated Articles
Master the 7-section structure for professional review analysis reports. Includes templates, real examples, data visualization tips, and common mistakes to avoid — whether you're reporting to executives, clients, or investors.
Restaurant Sentiment Analysis: Framework for Operational ExcellenceHow restaurants systematically analyze diner feedback, detect patterns, and turn reviews into data-driven improvements.
Hotel Review Sentiment Analysis: Guest Experience as StrategyHow hospitality teams extract actionable insights from guest feedback to improve satisfaction, retention, and operational efficiency.