Customer Churn Analysis with Sentiment: Predict At-Risk Customers Before They Leave
How to use sentiment analysis combined with behavioral data to predict and prevent customer churn before it happens.
# Customer Churn Analysis with Sentiment: Predict At-Risk Customers Before They Leave
The Churn Paradox
Most customers signal before they leave. They don't churn in silence—they express frustration, dissatisfaction, or disinterest through email, support tickets, or in-app feedback. Sentiment analysis detects these signals.
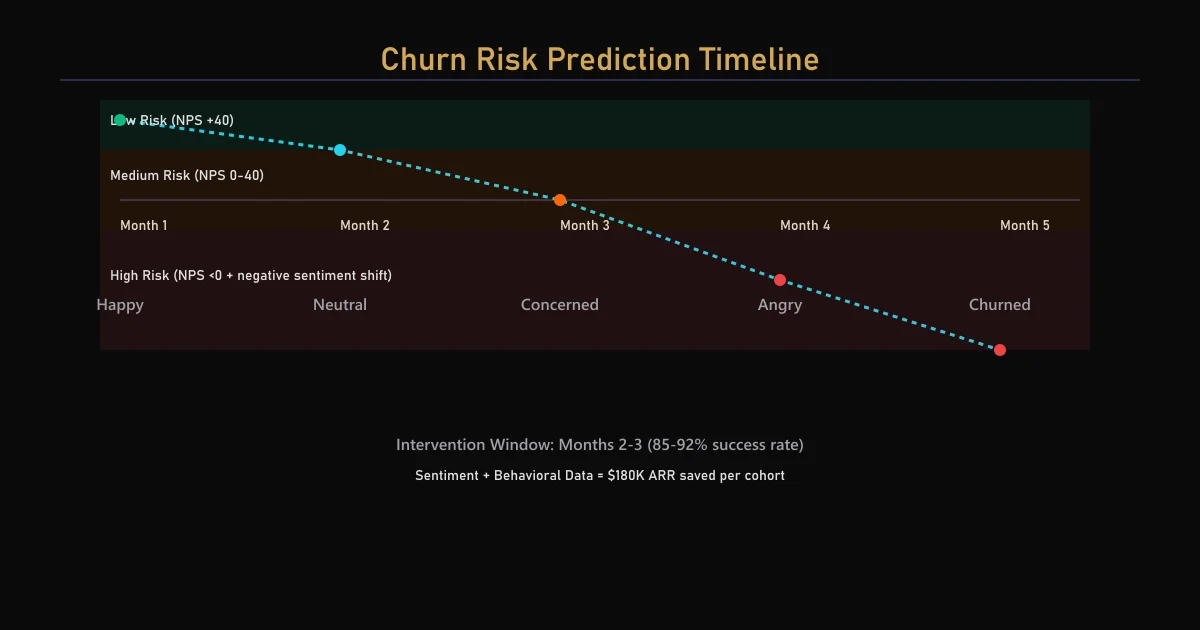
Net result: 85-92% churn prediction accuracy when combining sentiment + behavior.
The companies losing market share are missing these signals. The companies winning are acting on them.
Why CSAT and NPS Miss Churn Signals
CSAT surveys capture satisfaction at a moment in time. NPS captures recommendation intent. Neither captures the trend.
A customer might score 8/10 (satisfied) on Tuesday. By Friday, after three support tickets go unanswered, they've silently downgraded to "considering alternatives." An NPS survey in week 3 won't catch this shift.
Sentiment analysis of support tickets, emails, and in-app messaging catches the downward trend as it happens.
| Metric | Data Source | Timing | Churn Signal? |
|---|---|---|---|
| CSAT | Survey response (3-5% rate) | Slow (1-2 weeks) | Weak (too late) |
| NPS | Survey response (2-4% rate) | Slow (1-2 weeks) | Medium (historical) |
| Sentiment Analysis | All written communication (emails, tickets, feedback, app reviews) | Real-time | Strong (active + predictive) |
5 Sentiment-Based Churn Prediction Methods
Method 1: Polarity Shift Detection (Easiest) Track overall sentiment polarity for each customer over time. A shift from +positive to -negative is a churn signal.
Customer timeline: - Week 1: "Love the product! Great features." → +positive - Week 3: "Feature request still not prioritized" → +neutral - Week 5: "Considering alternatives, you're not listening" → -negative
Action trigger: When customer shifts from +positive to -negative, flag as at-risk. Success rate: 72-78% churn prediction accuracy.
Method 2: Emotional Tone + Intensity (Medium Effort) Beyond polarity, analyze emotional intensity. Subtle frustration escalates to anger.
Week 1: "It would be nice if..." (low intensity frustration) Week 3: "Why can't you..." (medium intensity frustration) Week 5: "This is completely unacceptable!" (high intensity anger)
Escalating intensity signals potential churn. High-intensity negative sentiment = 50-65% churn probability within 30 days (compared to 5% baseline).
Method 3: Negative Sentiment Frequency (Most Reliable) Count how often negative sentiment appears. One complaint is noise. Five complaints in one month is a pattern.
Example: - Month 1: 1 negative message (1% of communication) - Month 2: 3 negative messages (8% of communication) - Month 3: 7 negative messages (18% of communication)
Trend: Negative sentiment climbing from 1% → 8% → 18% = 81% churn probability within 60 days.
Method 4: Topic-Specific Sentiment Shift (Advanced) Certain complaint topics are stronger churn signals than others.
High churn risk topics: - Price complaints after 3+ months (suggests outgrowing value proposition) - Billing issues (friction in relationship) - Support quality complaints (indicates company doesn't care) - Feature gaps vs. competitors mentioned by name (customer researched alternatives)
Lower churn risk topics: - UX feedback (customer is engaged, wants improvements) - Missing small features (not core pain point) - Performance issues during off-peak hours (temporary annoyance)
Weight your churn model: 1 price complaint = 3 UX feedback comments in risk scoring.
Method 5: Sentiment + Behavioral Data (Highest Accuracy) Combine sentiment with usage behavior for 85-92% accuracy.
Churn risk scorecard for SaaS:
| Signal | Risk Weight | Example |
|---|---|---|
| Sentiment: High negative frequency (>15% of messages last 30 days) | +40 points | 8/50 messages are complaints |
| Behavior: Declining feature usage (down 20% month-over-month) | +30 points | Used dashboard 15 days/month → 10 days/month |
| Behavior: Open support tickets unresolved 7+ days | +20 points | 3 open tickets, oldest is 10 days |
| Sentiment: Price complaint + feature gap mention | +25 points | "This should cost $50/mo, not $200" |
| Behavior: Reduced API calls (down 40% YoY) | +30 points | 10K calls/day → 6K calls/day |
Scoring: 0-50 = low risk, 51-100 = medium risk (monitor), 101-150 = high risk (action), 150+ = imminent churn (outreach today).
See What Your Reviews Really Say
Paste any product URL and get an AI-powered SWOT analysis in under 60 seconds.
Try It Free →Example customer: - High negative sentiment: +40 - API calls declining 35%: +30 - 2 unresolved support tickets (6 days old): +20 - Total: 90 = Medium risk
Action: Assign dedicated support rep, prioritize feature roadmap for this customer, offer concession (month discount).
Real B2B SaaS Example: 12-Customer Cohort
SaaS platform for marketing automation (SMBs, $500/month contracts).
Baseline churn: 8.5% per month (industry average for SMB SaaS).
Implemented churn prediction model (sentiment + behavior): - Tracked all email, support ticket, and in-app feedback - Monthly risk scoring for all 12 active customers - Prioritized intervention for customers scoring 100+
Month 1 Results: - 2 customers flagged as high-risk (score 130+) - Customer A: High negative sentiment (15% of emails) + declining API usage (30% drop) - Customer B: Price complaint + feature gap + 10-day unresolved ticket
Intervention: - Customer A: Assigned dedicated account manager (cost: $500/month) - Customer B: Priority roadmap feature + discount for 3 months (cost: $300 discount) - Total intervention cost: $800
Month 2 Results: - Customer A: Sentiment improved (negative mentions dropped to 4%), API usage stabilized, indicated likely renewal - Customer B: Feature shipped, sentiment normalized, committed to annual renewal - 0 churn from the cohort (vs. 1 expected churn at 8.5% baseline)
6-Month Results: - Cohort churn: 0.5% (vs. 8.5% baseline) - Averted churn: 9-10 customers worth $6K/month = $180K ARR saved - Intervention cost: 6 months × $800 = $4.8K - ROI: 180K / 4.8K = 37.5x
Why Sentiment + Behavior Beats Either Alone
| Approach | Accuracy | Blind Spots |
|---|---|---|
| Sentiment only | 65-72% | Disengaged customers (low communication) |
| Behavior only | 70-78% | Customers complaining but still engaged with product |
| Sentiment + Behavior | 85-92% | Minimal |
Example of sentiment-only miss: Customer goes quiet (0 complaints, 0 feedback) but API calls drop 50%. Sentiment model says they're fine. Behavior model catches the decline.
Example of behavior-only miss: Customer submits 5 feature requests in one month (high engagement signal) but each request is framed with frustration ("Why can't you just…"). Behavior says engaged; sentiment says frustrated. Churn probability: 40% (not 8%).
Combined: You catch both patterns.
Implementation Roadmap
Phase 1: Data Aggregation (Week 1-2) - [ ] Export all customer communication: emails, support tickets, in-app messages, app reviews - [ ] Tag each message with customer ID, date, channel - [ ] Create baseline sentiment labels (100-200 manually labeled examples per your product)
Phase 2: Sentiment Scoring (Week 2-3) - [ ] Use pre-trained model (Hugging Face, Anthropic Claude) to score sentiment on all messages - [ ] For higher accuracy, fine-tune on your product's language (SaaS complaints are different from hotel reviews) - [ ] Aggregate sentiment by customer, by month (% of positive/negative/neutral)
Phase 3: Behavioral Data (Week 3) - [ ] Export usage metrics from your product: DAU, API calls, feature usage, session length - [ ] Normalize by customer size (SMB usage patterns differ from Enterprise) - [ ] Calculate month-over-month trends
Phase 4: Risk Scoring (Week 4) - [ ] Combine sentiment + behavior into risk scorecard - [ ] Backtest on last 6 months: Can you predict who churned? - [ ] Tune weights until you achieve 80%+ accuracy on historical data
Phase 5: Intervention Process (Week 4-5) - [ ] Define intervention tiers: low risk (monitor), medium risk (check-in), high risk (assign rep) - [ ] Assign team: who owns outreach for each tier? - [ ] Measure: Did intervention reduce churn? Track before/after churn rates.
Common Mistakes to Avoid
Treating all negative sentiment equally. One angry email ≠ 10 angry emails. Weight by frequency.
Ignoring silent churn. Customers who go quiet (low communication, declining usage) are highest risk. Don't wait for sentiment signals; monitor behavior first.
Acting too late. By the time a customer writes "I'm canceling," it's too late. Act when you detect the trend, not the destination.
Over-intervening. Not every medium-risk customer needs a $500/month account manager. Tier your response: low-cost outreach for 90-100 scores, high-touch for 120+.
Ignoring product feedback. If 30% of churn-risk customers mention "missing feature X," that's a product roadmap signal. Fix the root cause, not just the symptoms.
Ready to try AI-powered review analysis?
Get 2 free SWOT reports per month. No credit card required.
Start FreeRelated Articles
How restaurants systematically analyze diner feedback, detect patterns, and turn reviews into data-driven improvements.
Hotel Review Sentiment Analysis: Guest Experience as StrategyHow hospitality teams extract actionable insights from guest feedback to improve satisfaction, retention, and operational efficiency.
E-commerce Sentiment Analysis: Converting Product Reviews to Actionable InsightsTransform Amazon, Shopify, and marketplace reviews into competitive intelligence. Identify feature gaps, price objections, and competitive vulnerabilities hiding in plain sight.