How to Track Review Sentiment Over Time (Build a Sentiment Timeline)
Learn how to build a sentiment timeline that tracks review sentiment over time. Discover the right tracking cadence, how to interpret sentiment shifts, correlate changes with business events, and automate ongoing tracking with Sentimyne's SWOT comparison reports.
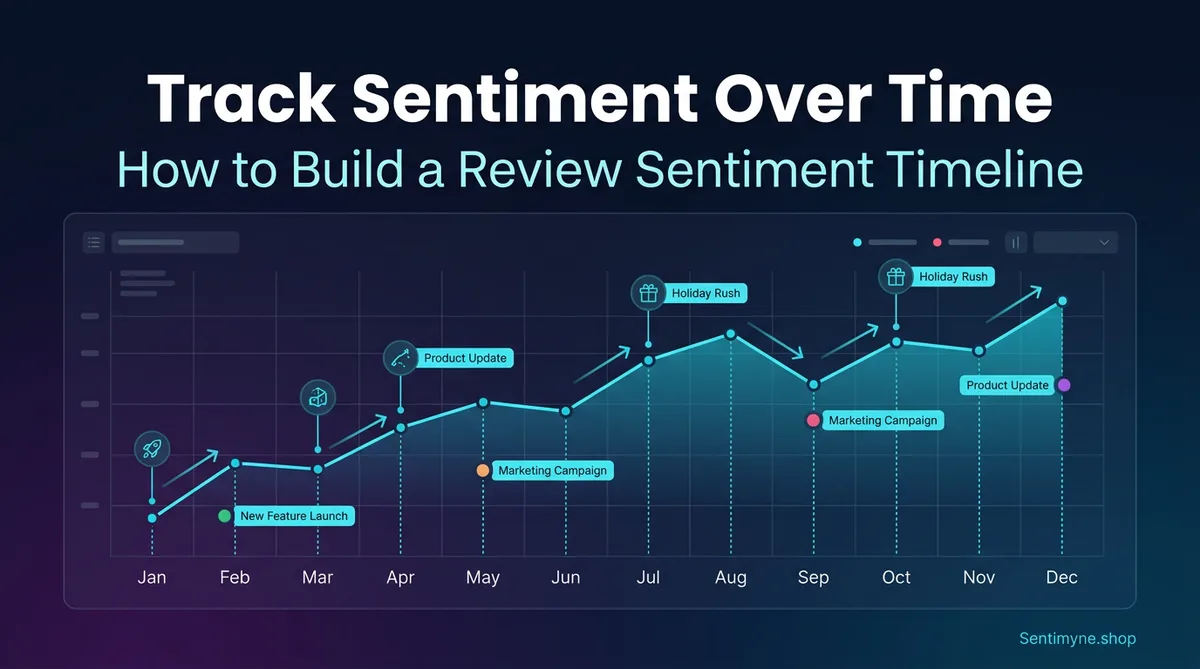
A single review analysis tells you where you stand today. A sentiment timeline tells you where you have been, why things changed, and where you are heading. The difference between the two is the difference between a snapshot and a movie — and product strategy requires the movie.
Most businesses that analyze their reviews do so as a one-time exercise. They run an analysis, identify the biggest complaints, create a plan to fix them, and move on. Six months later, they might run another analysis. But without tracking sentiment continuously between those two points, they have no way to know whether their fixes worked, whether new issues emerged, or whether external factors (competitor launches, market shifts, seasonal patterns) are affecting their review landscape.
A sentiment timeline solves this by creating a structured, ongoing record of how customers feel about your product over time. This guide covers how to build one, what cadence to use, how to interpret the data, and how to automate the process.
Why Point-in-Time Analysis Is Not Enough
Imagine you run a review analysis today and discover that 28% of your reviews mention slow performance. Is that good or bad? Without historical context, you cannot answer that question.
If slow performance mentions were at 45% three months ago and you shipped optimization improvements, 28% means your fix is working and you are on the right track. If slow performance mentions were at 12% three months ago and have been climbing steadily, 28% means you have a growing problem that is accelerating. Same number, completely different interpretation — and completely different strategic response.
The Three Limitations of Snapshot Analysis
1. No trend visibility A single analysis shows current themes and their frequency. It cannot tell you whether those themes are increasing, decreasing, or stable. A theme mentioned 30 times this month might be a chronic issue (mentioned 30 times every month for a year) or a sudden spike (mentioned 5 times last month). The appropriate response differs dramatically.
2. No causal attribution Without a timeline, you cannot connect sentiment changes to specific business events. Did that 0.3-star rating drop happen because of your latest update, a competitor launch, a viral negative review, or seasonal buying patterns? A timeline with event markers makes causal attribution possible.
3. No fix verification If you ship an improvement based on review feedback, the only way to verify it worked is to compare post-ship sentiment to pre-ship sentiment. Without a timeline, you are guessing.
"We were celebrating because our latest review analysis showed 85% positive sentiment. Then we built a timeline and realized it was 92% positive six months ago. We weren't doing well — we were declining and didn't know it."
How to Build a Sentiment Timeline
A sentiment timeline is a structured record of review metrics captured at regular intervals. Here is how to build one from scratch.
Step 1: Define Your Metrics
Track these core metrics at each interval:
Primary metrics: - Overall sentiment score — The average sentiment polarity across all reviews in the period (-1.0 to +1.0) - Star rating average — The mean star rating for the period - Review volume — Total new reviews received in the period
Theme-level metrics: - Top 5 themes by mention volume — What customers are talking about most - Theme sentiment scores — Sentiment polarity for each major theme - New themes — Topics that appeared for the first time in this period
Comparative metrics: - Positive-to-negative ratio — Ratio of positive to negative reviews - Sentiment change from previous period — Delta from last measurement
Step 2: Choose Your Tracking Cadence
The right cadence depends on your product lifecycle and review volume:
| Scenario | Recommended Cadence | Rationale |
|---|---|---|
| Post-launch (first 90 days) | Weekly | Rapid feedback accumulation, need to catch issues fast |
| Active development (frequent releases) | Bi-weekly | Track impact of each release cycle |
| Established product (stable) | Monthly | Sufficient frequency for trend detection |
| Mature product (infrequent changes) | Quarterly | Lower review velocity, quarterly is sufficient |
| During a crisis (PR issue, major bug) | Daily | Need real-time damage assessment and recovery tracking |
Most products operate on a monthly cadence during normal periods, shifting to weekly or bi-weekly during launches and crises. The key is consistency — gaps in your timeline create blind spots.
Step 3: Establish Your Baseline
Before you can track changes, you need a starting point. Run a comprehensive analysis covering the last 6 months of reviews to establish:
- Your average sentiment score across the full period
- The normal range of variation (what counts as a "normal" fluctuation vs. a meaningful shift)
- Your historical theme profile (which themes are chronic, which are seasonal, which are new)
This baseline becomes your reference point. Future measurements are interpreted relative to it.
Step 4: Create Your Tracking Dashboard
Your sentiment dashboard should present data in three layers:
Layer 1: The Trend Line A time-series chart showing overall sentiment score over time. This is the highest-level view — one glance tells you whether things are improving, declining, or stable.
Layer 2: The Theme Breakdown Below the trend line, a table or heatmap showing how individual themes are performing over time. This reveals which specific areas are driving the overall trend.
Layer 3: The Event Overlay Annotate your trend line with significant business events: product releases, price changes, competitor launches, marketing campaigns, PR incidents. This creates the causal connection between what you did and how customers responded.
Example Dashboard Data
| Month | Overall Sentiment | Star Avg | Volume | Top Issue | Event Marker |
|---|---|---|---|---|---|
| Oct 2025 | +0.42 | 4.1 | 187 | UI complexity (18%) | — |
| Nov 2025 | +0.38 | 4.0 | 203 | UI complexity (22%) | Competitor launched v3 |
| Dec 2025 | +0.35 | 3.9 | 156 | Performance (25%) | Holiday traffic spike |
| Jan 2026 | +0.44 | 4.1 | 198 | Performance (14%) | Shipped performance fix |
| Feb 2026 | +0.51 | 4.3 | 221 | Feature requests (20%) | New onboarding flow launched |
| Mar 2026 | +0.53 | 4.3 | 234 | Feature requests (22%) | — |
The story this timeline tells: sentiment dipped in Q4 2025 due to rising performance complaints (exacerbated by holiday traffic) and competitive pressure. The January performance fix reversed the trend. The February onboarding improvement pushed sentiment to its highest point. March is stable, with feature requests replacing complaints as the dominant theme — a healthy sign.
Without the timeline, the March analysis would show "+0.53 sentiment with 22% feature requests." That is a fact. With the timeline, you see a recovery arc driven by specific improvements. That is a narrative — and narratives drive strategy.
What Cadence to Track: Detailed Guidance
Weekly Tracking for Launches
During the first 90 days after a product launch or major update, track weekly. New products generate their highest review volume in this period, and early negative themes that go unaddressed compound rapidly.
Weekly tracking checklist: - [ ] Pull all new reviews from the past 7 days across all platforms - [ ] Calculate sentiment score and star average for the week - [ ] Identify any new themes not present in previous weeks - [ ] Flag any theme that increased by more than 5 percentage points - [ ] Compare to pre-launch baseline - [ ] Share findings with the product team by Monday EOD
Monthly Tracking for Established Products
For products past the launch phase, monthly tracking balances thoroughness with sustainability. The monthly cadence aligns with most product planning cycles and provides enough data points for reliable trend detection.
Monthly tracking process: 1. Run a comprehensive review analysis covering the past 30 days 2. Update your dashboard with new data points 3. Compare to the previous month and the same month last year (if available) 4. Identify trends that have persisted for 3+ consecutive months 5. Generate a brief summary for stakeholders
Quarterly Benchmarks
Regardless of your primary cadence, conduct a deeper quarterly analysis that includes:
- Quarter-over-quarter comparison of all metrics
- Year-over-year comparison if data exists
- Competitive sentiment analysis (track competitors on the same cadence)
- Strategic recommendations based on trend data
Interpreting Sentiment Shifts
Not every change in sentiment is meaningful. Random variation, seasonal patterns, and sample size effects can all create the appearance of a trend where none exists. Here is how to distinguish signal from noise.
What Does a 0.2-Point Drop Mean?
A 0.2-point drop in sentiment score (for example, from +0.45 to +0.25) is significant. To put this in perspective:
| Sentiment Change | Interpretation | Typical Cause | Urgency |
|---|---|---|---|
| +/- 0.05 | Normal variation | Random fluctuation, sample variation | No action needed |
| +0.10 | Minor improvement | Successful fix, positive press | Note and continue |
| +0.20 | Significant improvement | Major improvement shipped, competitive withdrawal | Promote and reinforce |
| +0.30+ | Exceptional improvement | Transformative update, viral positive event | Capitalize aggressively |
A 0.2-point drop means that the proportion of negative reviews increased substantially or the proportion of highly positive reviews decreased substantially. Either way, something changed in the customer experience that warrants investigation.
The Three-Month Rule
Do not react to a single month's sentiment change. Use the three-month rule: a trend is confirmed when it persists for three consecutive measurements in the same direction. One month of decline is a data point. Three months of decline is a trend.
The exception is extreme shifts (0.3+ points in a single period). These warrant immediate investigation regardless of whether they persist.
Seasonal Patterns to Account For
Many products exhibit seasonal sentiment patterns that can mask or amplify real trends:
- Holiday season (Nov-Dec): Higher purchase volume brings more casual buyers who tend to leave more negative reviews (expectation mismatches from gifting, impulse purchases, etc.)
- Post-holiday (Jan-Feb): Spike in negative reviews from gift recipients who did not choose the product themselves
- Back-to-school (Aug-Sep): Products used in education see review spikes with school-specific use cases
- Tax season (Mar-Apr): B2B products may see sentiment shifts as annual budget renewals trigger re-evaluations
See What Your Reviews Really Say
Paste any product URL and get an AI-powered SWOT analysis in under 60 seconds.
Try It Free →Build a seasonal adjustment into your analysis by comparing each month to the same month last year rather than (or in addition to) the previous month.
Correlating Sentiment Changes With Business Events
The most powerful application of a sentiment timeline is causal analysis — connecting what happened in your business to how customers responded.
Building Your Event Calendar
Maintain a log of every significant business event that could impact reviews:
Product events: - Version releases (include version number and key changes) - Bug fixes and patches - Feature launches - Pricing changes - Terms of service updates
External events: - Competitor product launches - Competitor pricing changes - Industry news or regulatory changes - Viral social media mentions (positive or negative) - Media reviews or coverage
Marketing events: - Major campaign launches - Influencer partnerships - Conference appearances - Product Hunt launches
The Correlation Analysis
Overlay your event calendar on your sentiment timeline. Look for:
Same-period correlations: An event in March that corresponds to a sentiment shift in March suggests a direct, immediate impact. Example: shipping a major bug fix that immediately reduces complaint volume.
Lagged correlations: An event in March that corresponds to a sentiment shift in April or May suggests a delayed impact. Example: a competitor launching a feature that customers start comparing to yours over the following weeks.
Absence of correlation: A sentiment shift with no corresponding event is the most interesting case — it suggests an organic change in customer expectations or a competitor action you did not track. Investigate by reading the reviews from that period to identify the cause.
Example Correlation Analysis
| Date | Event | Sentiment Effect | Lag | Confidence |
|---|---|---|---|---|
| Jan 15 | Shipped v3.2 performance fix | +0.09 increase in performance theme sentiment | 2 weeks | High — direct mention of "faster since update" |
| Feb 1 | Competitor launched free tier | -0.04 overall, -0.12 on pricing theme | 3 weeks | Medium — some reviews mention competitor pricing |
| Feb 20 | New onboarding video tutorial | +0.15 on onboarding theme sentiment | 1 week | High — multiple reviews mention "the tutorial helped" |
| Mar 5 | No event identified | -0.08 on mobile theme sentiment | N/A | Low — need to investigate mobile reviews |
The March 5 entry is the action item. Something changed in mobile experience sentiment without a corresponding business event. Reading the mobile-themed reviews from that period might reveal a device-specific issue, an OS update that caused compatibility problems, or a competitor's mobile app improvement that raised the bar.
Building a Review Sentiment Dashboard
Tool Options
You can build a sentiment dashboard with varying levels of sophistication:
Level 1: Spreadsheet (Google Sheets / Excel) Create a simple spreadsheet with columns for date, overall sentiment, star average, volume, and top themes. Add a chart that plots sentiment over time. This works for teams tracking a single product with moderate review volume.
Level 2: Business Intelligence Tool (Looker, Tableau, Power BI) For teams already using BI tools, create a dedicated dashboard that pulls from your review data source. This supports filtering, drill-downs, and automated refresh.
Level 3: Purpose-Built Review Analytics Use a tool specifically designed for review analysis that includes built-in trend tracking. This eliminates the data pipeline work and provides analysis-ready output.
Dashboard Design Principles
Regardless of the tool, follow these design principles:
- Lead with the trend line — The first thing anyone sees should be the overall sentiment over time
- Enable drill-down — Allow clicking from the overall trend to theme-level trends to individual reviews
- Include the event overlay — Business events marked on the timeline are what make the data actionable
- Show period-over-period change — Display both absolute values and deltas
- Set visual thresholds — Color-code cells or sections: green for improving, yellow for stable, red for declining
Automated Tracking With Sentimyne
Building and maintaining a sentiment timeline manually requires consistent discipline: pulling reviews, calculating metrics, updating spreadsheets, and generating reports on a fixed schedule. Most teams start strong and gradually fall off as other priorities consume their time.
Sentimyne automates the most time-consuming parts of this process. Here is how to use it for ongoing sentiment tracking:
The Monthly SWOT Comparison Method
- On the first Monday of each month, paste your product URL into Sentimyne and generate a fresh SWOT analysis
- Save the report with the month and year in the filename (e.g., "SWOT-March-2026")
- Compare the new SWOT to the previous month's SWOT — note which strengths persisted, which weaknesses improved or worsened, which opportunities are new, and which threats escalated
- Update your sentiment dashboard with the month's data points extracted from the SWOT
- Share the month-over-month comparison with your team
This method takes approximately 15 minutes per month and produces a structured trend record that accumulates into a comprehensive sentiment timeline over quarters and years.
Building the Comparison Habit
The key to sustainable sentiment tracking is making it low-effort and high-value. Sentimyne's 60-second analysis removes the effort barrier. The value becomes self-evident after 3 months, when you have enough data points to see trends and make correlation-based decisions.
A practical schedule:
| Day | Action | Time Required |
|---|---|---|
| 1st Monday | Run Sentimyne analysis, update dashboard | 15 min |
| 1st Monday | Compare to previous month's SWOT | 10 min |
| 1st Monday | Share findings with stakeholders | 5 min |
| Total monthly time investment | 30 min |
Compare this to the manual alternative: reading 200+ reviews, categorizing themes, calculating sentiment metrics, updating the dashboard, and writing a summary. That is 4-6 hours of work per month — work that usually gets deprioritized and skipped.
The free plan (2 reports per month) supports monthly tracking for a single product. The Pro plan at $29/month supports tracking multiple products, running competitive analyses, and doing weekly check-ins during launches or crises. The Team plan at $49/month adds shared access so that multiple team members can run and compare analyses.
"We've been running monthly Sentimyne SWOTs for 8 months now. The accumulated timeline showed us a slow creep in 'integration' complaints that we would never have caught in any single analysis. We prioritized an integration overhaul in Q2 that addressed the trend before it became a rating-impacting problem."
Advanced: Predictive Sentiment Modeling
Once you have 12+ months of sentiment timeline data, you can begin making predictions:
Trend Extrapolation
If a negative theme has been growing at 3 percentage points per month for the last 4 months, and no fix is planned, you can estimate when it will become the dominant theme in your reviews. This creates urgency for roadmap prioritization — "If we don't address this by Q3, performance complaints will overtake feature requests as our primary negative theme."
Seasonal Forecasting
With a full year of data, you can predict seasonal sentiment patterns and proactively prepare. If you know that January always brings a sentiment dip due to post-holiday gift recipients, you can:
- Pre-position customer support resources
- Ship stability-focused updates in December rather than feature-heavy ones
- Prepare review response templates for common seasonal complaints
Competitive Correlation Modeling
If you track competitor sentiment alongside your own, you can model how competitor actions affect your reviews. For example, if a competitor's major launch consistently causes a 0.05-0.10 dip in your pricing sentiment (as customers re-evaluate value), you can proactively communicate your product's value proposition before a known competitor launch.
Frequently Asked Questions
How far back should I go when establishing a sentiment baseline?
Six months is the minimum for a useful baseline. Twelve months is ideal because it captures seasonal patterns. Going back further than 18 months introduces noise from older product versions that may not be relevant to the current experience. If your product has undergone a major overhaul, reset your baseline to the launch of the current version — pre-overhaul data will skew your trend analysis.
What tools can I use to build a sentiment timeline without coding?
A Google Sheets spreadsheet is the simplest option — create columns for date, sentiment score, star average, volume, and top themes, then add a line chart for the trend visualization. For more sophistication, use Notion or Airtable with timeline views. The key is not the tool — it is the consistency of measurement. Sentimyne provides the analysis data; you just need a place to record and visualize it over time.
How do I handle outlier reviews that skew sentiment data?
Outlier reviews — extremely positive or negative reviews that are disproportionately long, emotional, or detailed — can skew small sample sizes. If your monthly review volume is above 100, outliers self-correct through volume. If you are working with fewer reviews, consider using median sentiment rather than mean sentiment as your primary metric, since median is resistant to outlier influence. Never remove outlier reviews from your data — instead, acknowledge their effect and use resistant statistics.
Can I track competitor sentiment on the same timeline as my own?
Yes, and you should. Run the same analysis on competitor products at the same cadence and plot their sentiment alongside yours on the same dashboard. The relative trend is often more informative than the absolute trend — if your sentiment is declining but a competitor's sentiment is declining faster, the market is shifting (not just your product). If your sentiment is stable while a competitor's is rising, you are losing relative ground even though nothing changed on your end.
What is a "good" sentiment score to aim for?
Sentiment scores are relative to your industry and product category. A +0.50 sentiment score might be excellent for an enterprise B2B product (where users have complex, sometimes frustrating workflows) and mediocre for a consumer app (where users expect delight). Rather than targeting an absolute number, target consistent improvement. A 0.05-0.10 point improvement per quarter is a strong trajectory. Stability at a high level (above +0.40 for most categories) is also a valid target. The warning zone is sustained decline of any magnitude over 3+ months — that requires intervention regardless of the absolute score level.
Ready to try AI-powered review analysis?
Get 2 free SWOT reports per month. No credit card required.
Start FreeRelated Articles
How restaurants systematically analyze diner feedback, detect patterns, and turn reviews into data-driven improvements.
Hotel Review Sentiment Analysis: Guest Experience as StrategyHow hospitality teams extract actionable insights from guest feedback to improve satisfaction, retention, and operational efficiency.
Customer Churn Analysis with Sentiment: Predict At-Risk Customers Before They LeaveHow to use sentiment analysis combined with behavioral data to predict and prevent customer churn before it happens.