Customer Experience Analytics: The Complete Guide to Measuring CX
Master customer experience analytics with this comprehensive guide covering key CX metrics (NPS, CSAT, CES, sentiment scores), data sources, dashboard design, and common measurement mistakes. Learn why review analysis is the most underused CX data source and how to integrate it into your analytics program.
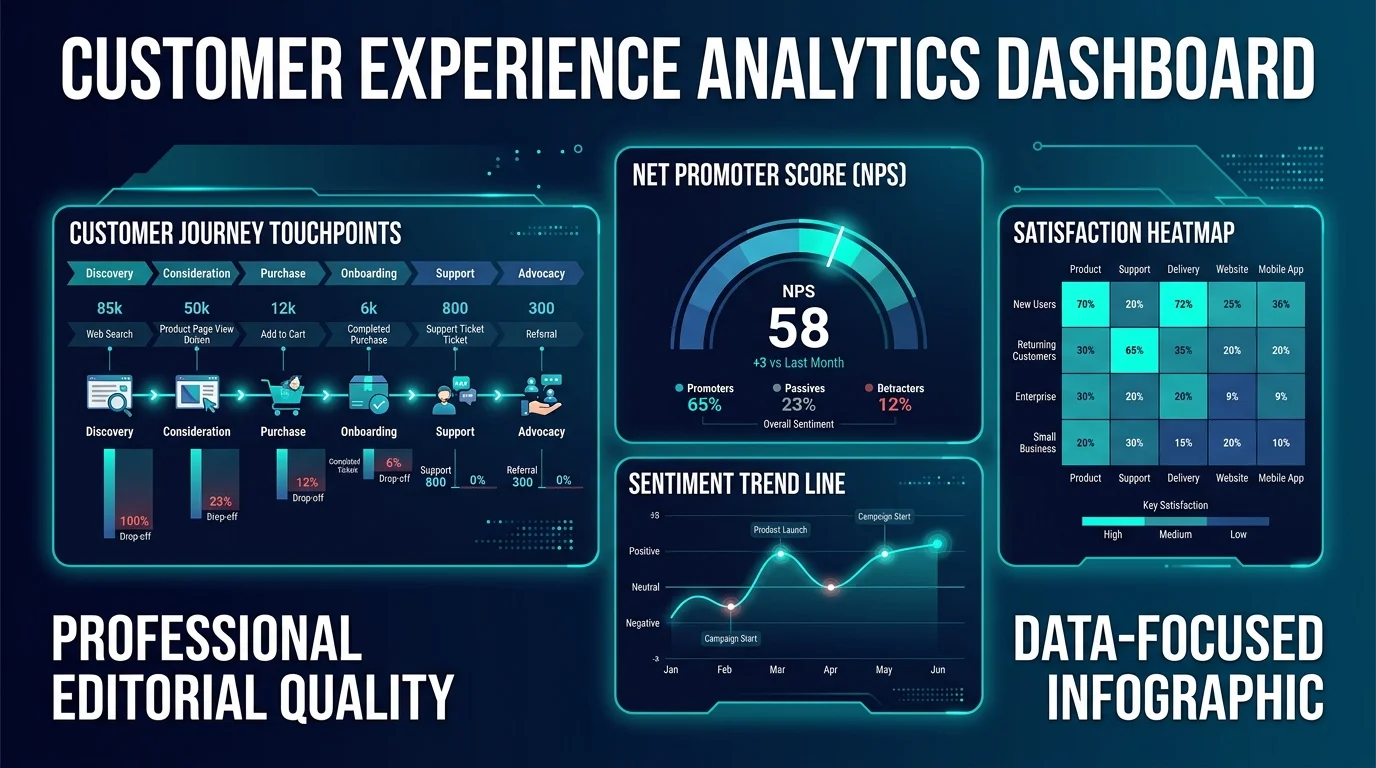
Customer experience analytics is the practice of collecting, measuring, and interpreting data about how customers interact with and perceive your business across every touchpoint. It turns subjective feelings — satisfaction, frustration, delight, confusion — into quantifiable metrics that drive business decisions.
The challenge is not a lack of data. Most companies are drowning in customer data. The challenge is turning that data into a coherent picture of the customer experience and identifying where to intervene. A support ticket about a confusing checkout flow, a three-star Amazon review mentioning slow shipping, a churned customer's exit survey citing price — these are all CX data points. Without analytics, they are isolated complaints. With analytics, they reveal patterns that point to systemic improvements.
This guide covers the foundational metrics, the data sources most companies overlook (especially reviews), how to build a CX analytics dashboard that people actually use, and the mistakes that turn CX measurement programs into expensive vanity projects.
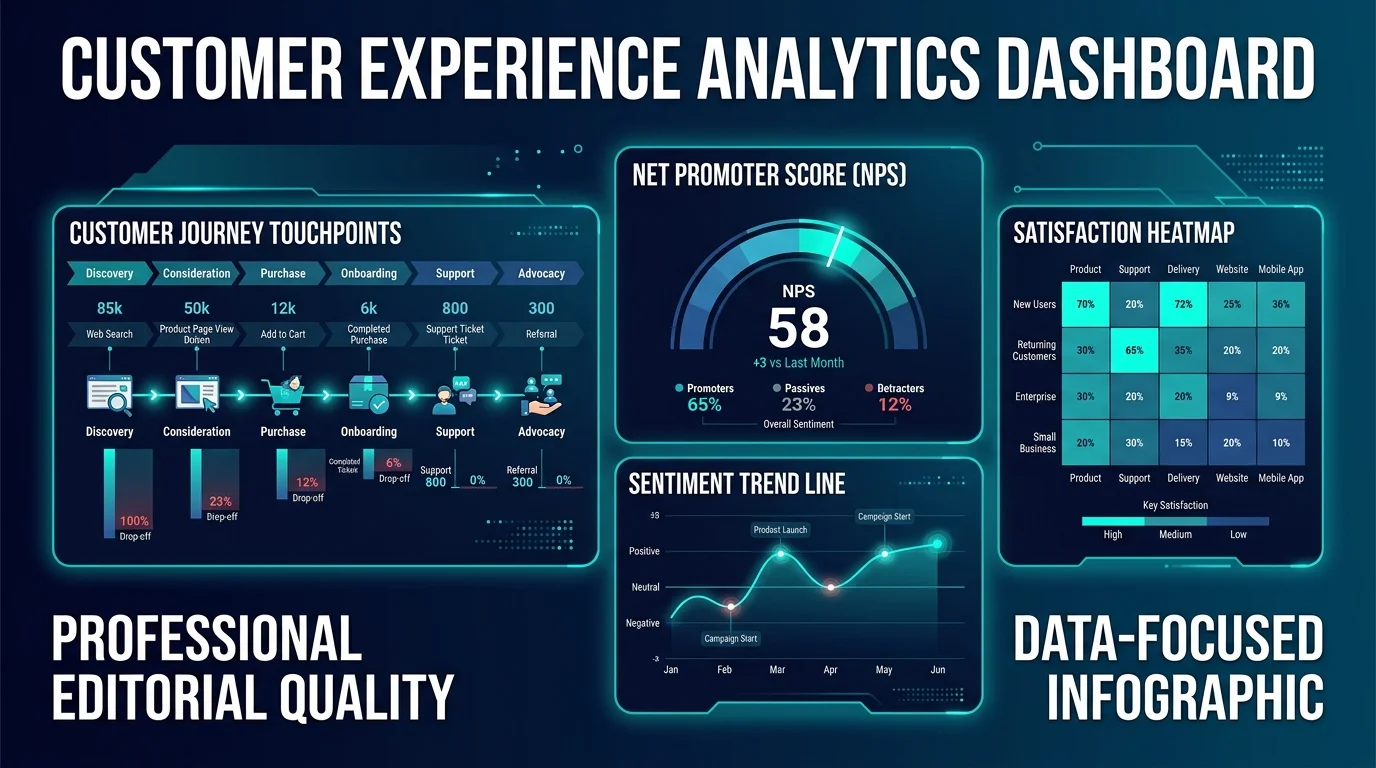
The Core CX Metrics You Should Be Tracking
Every CX analytics program starts with metrics. The danger is tracking too many (analysis paralysis) or too few (false confidence). Here are the metrics that matter, what each actually measures, and where each falls short.
Net Promoter Score (NPS)
What it measures: Customer loyalty, expressed as willingness to recommend your product or service.
How it works: Customers answer one question — "How likely are you to recommend us to a friend or colleague?" — on a 0-10 scale. Respondents are classified as Promoters (9-10), Passives (7-8), or Detractors (0-6). NPS = % Promoters minus % Detractors.
Strengths: Simple, universal, benchmarkable across industries. Widely understood by executives. Correlates with revenue growth in most studies.
Limitations: Does not tell you why customers feel the way they do. A declining NPS score is an alarm bell, not a diagnosis. The single-question format sacrifices depth for simplicity.
Good benchmark: NPS above 50 is excellent in most industries. Above 70 is world-class. Below 0 signals serious problems.
Customer Satisfaction Score (CSAT)
What it measures: Satisfaction with a specific interaction, transaction, or experience.
How it works: Customers rate their satisfaction on a scale (typically 1-5 or 1-7) immediately after an interaction. CSAT = (number of satisfied responses / total responses) x 100.
Strengths: Interaction-specific, so you can identify exactly which touchpoints are underperforming. Fast to deploy, high response rates when triggered contextually.
Limitations: Measures a moment, not the relationship. A customer can be satisfied with a support call and still churn because of pricing. CSAT does not capture cumulative experience.
Good benchmark: 75-85% is the typical range for well-performing organizations. Below 70% indicates consistent friction.
Customer Effort Score (CES)
What it measures: How easy or difficult it was for the customer to accomplish their goal.
How it works: Customers rate agreement with a statement like "The company made it easy for me to handle my issue" on a 1-7 scale.
Strengths: Effort is a stronger predictor of churn than satisfaction. Customers tolerate imperfect experiences if the process is easy. CES identifies friction points that CSAT misses.
Limitations: Narrow scope — only measures ease of a specific interaction, not overall experience quality.
Good benchmark: CES above 5.5 (on a 7-point scale) indicates low-effort experiences. Below 4.0 signals significant friction.
Sentiment Score
What it measures: The emotional valence of customer feedback — positive, negative, or neutral — extracted from unstructured text (reviews, support tickets, social posts).
How it works: AI/NLP models analyze text and assign a sentiment score, typically from -1.0 (extremely negative) to +1.0 (extremely positive). Advanced tools break this down by feature or theme (aspect-based sentiment analysis).
Strengths: Captures emotion from feedback customers provide naturally, without being surveyed. Can be applied retroactively to historical data. Scales to thousands of data points.
Limitations: Accuracy depends on the NLP model. Sarcasm, irony, and context-dependent language reduce precision. Different tools produce different scores for the same text.
Good benchmark: Average sentiment above +0.3 indicates generally positive perception. Below -0.1 signals a problem. For more on sentiment scoring methodology, see our what is sentiment analysis guide.
The CX Metrics Comparison
| Metric | What It Measures | Data Source | Update Frequency | Actionability | Blind Spots |
|---|---|---|---|---|---|
| NPS | Loyalty/advocacy | Survey | Quarterly/monthly | Low (no "why") | Does not explain drivers |
| CSAT | Interaction satisfaction | Post-interaction survey | Per interaction | Medium | Moment-specific, not cumulative |
| CES | Ease of experience | Post-interaction survey | Per interaction | High for friction | Narrow scope |
| Sentiment Score | Emotional valence | Reviews, tickets, social | Continuous | High with theme analysis | Depends on NLP quality |
| Churn Rate | Customer loss | CRM/billing data | Monthly | High (lagging indicator) | Tells you who left, not why |
| First Contact Resolution | Support effectiveness | Support system | Per ticket | High for support ops | Only measures support channel |
"NPS tells you how customers feel. CSAT tells you how an interaction went. CES tells you how hard you made them work. Sentiment analysis tells you why they feel that way. You need all four."
The Data Sources Most Companies Overlook
CX analytics programs typically pull from three sources: surveys, support tickets, and CRM data. This covers perhaps 30-40% of available customer signal. The remaining 60-70% lives in channels most companies never systematically analyze.
Product Reviews: The Most Underused CX Data Source
Product reviews are the single richest source of unsolicited customer experience data, and the most consistently ignored by CX analytics programs.
Consider what reviews contain:
- Feature-level feedback — customers describe specific features they love, hate, or wish existed
- Comparative context — customers frequently mention competitors and explain why they switched (or almost did)
- Use-case descriptions — customers describe how they actually use the product, often in ways the company did not anticipate
- Emotional intensity — the language and length of reviews signal how strongly customers feel, not just whether they are positive or negative
- Purchase decision factors — what convinced them to buy, what almost stopped them, what they wish they had known before purchasing
A company with 500 product reviews across Amazon, Trustpilot, and G2 has 500 unsolicited mini-interviews — each containing multiple CX data points. Manual analysis is impractical at this scale. AI-powered review analysis tools like Sentimyne extract themes, sentiment scores, competitive mentions, and SWOT insights from review data across 12+ platforms in under 60 seconds.
For a detailed walkthrough of how to integrate review data into CX programs, see our voice of customer from reviews guide.
Social Media and Community Feedback
Customers discuss your product on Twitter, Reddit, Facebook, and industry forums. These conversations are unfiltered, unprompted, and often more honest than survey responses. The signal-to-noise ratio is lower than reviews (more casual mentions, jokes, and off-topic references), but the emerging trends that appear in social data often precede shifts in review sentiment and survey scores by weeks or months.
For methodology on mining social platforms, see our Reddit and social media review mining guide.
Support Conversation Transcripts
Most companies track support metrics (resolution time, ticket volume, satisfaction rating). Fewer analyze the actual content of support conversations. Support transcripts contain detailed problem descriptions, workarounds customers have tried, feature requests framed as problems, and emotional cues that indicate churn risk.
Sales Call and Demo Recordings
Sales conversations reveal what prospects expect, what competitors they are evaluating, what objections they raise, and what promises were made during the sales process. When CX issues arise post-sale, the root cause is often an expectation set during sales that the product cannot meet. Without analyzing sales conversations, CX teams cannot identify these expectation gaps.
Building a CX Analytics Dashboard That Gets Used
The graveyard of CX programs is filled with beautiful dashboards that nobody opens. A dashboard that gets used — and drives decisions — follows these principles.
Principle 1: Lead With Actions, Not Numbers
Most CX dashboards lead with metrics: NPS is 42, CSAT is 78%, sentiment is +0.31. These numbers answer "how are we doing?" but not "what should we do?" Effective dashboards lead with the actions that the data suggests.
Instead of "NPS dropped 5 points this quarter," the dashboard should say "NPS dropped 5 points — driven by a 23% increase in Detractors citing checkout friction. Three specific checkout issues identified in review and support data."
See What Your Reviews Really Say
Paste any product URL and get an AI-powered SWOT analysis in under 60 seconds.
Try It Free →Principle 2: Combine Quantitative and Qualitative
Numbers without context are meaningless. A CSAT score of 72% tells you performance is below benchmark. The review quotes explaining why it is 72% — "took three attempts to get a refund," "support agent was helpful but could not solve my issue," "the product works but the mobile experience is terrible" — tell you what to fix.
Your dashboard should display metrics alongside the verbatim customer quotes that illustrate those metrics. For guidance on blending data types, see our qualitative vs quantitative review analysis guide.
Principle 3: Segment Relentlessly
Aggregate CX metrics hide as much as they reveal. An NPS of 50 might be composed of enterprise customers at 70 and SMB customers at 25 — a pattern that demands completely different interventions than a uniform 50 across segments.
Segment your CX data by:
- Customer tier/plan (free, paid, enterprise)
- Product line or feature set
- Acquisition channel
- Geography/region
- Customer tenure (new vs. established)
- Use case or industry vertical
Principle 4: Show Trends, Not Snapshots
A single NPS reading is a data point. Six months of NPS readings is a trend line. Trends tell you whether things are getting better or worse and whether your interventions are working. Every metric on your dashboard should show at least 6 months of historical data.
Principle 5: Include Competitive Context
Your CX metrics exist in a competitive context. An NPS of 40 might be excellent in an industry where the average is 20, or terrible in an industry where the average is 65. Include competitive benchmarks wherever possible. Review analysis tools can provide competitive sentiment comparisons — see our benchmark product vs competitor reviews guide.
The CX Dashboard Blueprint
| Dashboard Section | Metrics | Data Source | Update Frequency |
|---|---|---|---|
| Executive Summary | NPS, CSAT, CES, overall sentiment | All sources | Weekly |
| Theme Trends | Top 5 positive themes, top 5 negative themes, theme velocity | Reviews, support tickets | Weekly |
| Competitive Position | Sentiment vs. top 3 competitors, share of voice | Reviews, social | Monthly |
| Touchpoint Scores | CSAT by interaction type (purchase, support, onboarding) | Post-interaction surveys | Per interaction |
| Churn Risk Signals | Declining sentiment accounts, repeated complaints, CES drops | CRM + support + reviews | Daily |
| Verbatim Highlights | Top 10 positive quotes, top 10 negative quotes, emerging themes | Reviews, support | Weekly |
Integrating Review Data Into CX Analytics
Review data is not a replacement for surveys and support analytics. It is a complement that fills critical gaps in your CX picture. Here is how to integrate it effectively.
Step 1: Establish Your Review Baseline
Before tracking trends, establish where you stand. Analyze your current reviews across all platforms to identify:
- Overall sentiment score and distribution
- Top themes (positive and negative)
- Feature-level sentiment scores
- Competitive mentions and comparative sentiment
Tools like Sentimyne generate this baseline analysis in under 60 seconds. The free tier supports 2 analyses per month — enough to establish your baseline for your primary product and one competitor. The Pro plan at $29/month provides unlimited analyses for ongoing tracking.
Step 2: Map Review Themes to CX Metrics
Connect the themes emerging from review analysis to your existing CX metrics. If reviews consistently mention "difficult setup," that should correlate with (and help explain) a low CES score for the onboarding touchpoint. If reviews praise "fast support response," that should align with high CSAT scores for your support team.
When themes in reviews do not correspond to movements in your survey metrics, investigate. It may mean your surveys are not asking about the things customers care about most — a common and expensive blind spot.
Step 3: Track Review Sentiment Over Time
Review sentiment is not a one-time measurement. Track it weekly or monthly alongside your other CX metrics. Shifts in review sentiment often precede changes in NPS and CSAT by 4-8 weeks, making reviews a leading indicator of CX trajectory. For methodology, see our track review sentiment over time guide.
Step 4: Use Reviews for Root Cause Analysis
When a CX metric declines, reviews often contain the explanation. NPS dropped? Check recent reviews for emerging negative themes. CSAT fell for a specific touchpoint? Search reviews for mentions of that interaction. Reviews provide the qualitative depth that survey scores lack — the specific, detailed, emotionally charged descriptions of what went wrong.
Common CX Analytics Mistakes
Mistake 1: Measuring Without Acting
The most common CX analytics failure is not measurement quality — it is the gap between insight and action. Companies invest thousands in VoC tools, build elaborate dashboards, and generate monthly reports that nobody acts on. CX analytics is only valuable if it changes decisions. Every insight should connect to a specific team, a specific decision, and a specific timeline.
Mistake 2: Over-Indexing on NPS
NPS is a useful relationship metric, but it has become a proxy for the entire CX program in too many organizations. Leaders obsess over the score without understanding what drives it. Worse, teams game NPS by selectively surveying happy customers, timing surveys after positive interactions, or pressuring customers to give high scores.
Mistake 3: Ignoring Unsolicited Feedback
Surveys are solicited feedback — you asked, they answered. Reviews, social posts, and support conversations are unsolicited — they volunteered these opinions. Research consistently shows that unsolicited feedback is more predictive of behavior (purchasing, churning, recommending) than solicited feedback. A CX program that relies solely on surveys is listening through a filtered microphone.
Mistake 4: Treating CX as a Department Instead of a Discipline
When CX analytics lives in a single department — usually "Customer Experience" or "Customer Success" — it becomes siloed. Product teams make roadmap decisions without CX data. Marketing crafts messaging without understanding customer pain points. Sales sets expectations without knowing what causes post-sale disappointment. CX analytics should feed into every function, not just the CX team.
Mistake 5: Measuring Satisfaction Without Measuring Effort
Customers do not just want to be satisfied. They want things to be easy. A customer who resolved their issue but had to make four phone calls, explain the problem three times, and wait on hold for 20 minutes might report satisfaction with the outcome but will not remain a customer. CES captures this dimension. If you are only tracking CSAT and NPS, you are missing the effort dimension.
"The companies with the best CX metrics are not the ones that make customers happy — they are the ones that make customers' lives easy. Reduce effort first, then optimize for delight."
The Role of AI in CX Analytics
AI has transformed CX analytics from a periodic reporting exercise into a continuous intelligence operation. Specific applications include:
Theme extraction. AI clusters thousands of unstructured feedback points (reviews, tickets, social posts) into coherent themes automatically, eliminating the need for manual coding. For technical depth, see our NLP review analysis explained guide.
Sentiment scoring. AI assigns sentiment scores to text at the feature level — not just "this review is positive" but "this review is positive about battery life and negative about screen quality."
Anomaly detection. AI identifies unusual patterns — a sudden spike in negative sentiment about a specific feature, an unexpected drop in CES for a particular touchpoint — and alerts the team before small issues become crises.
Predictive analytics. AI models correlate CX signals with business outcomes, predicting which customers are likely to churn, which product features will drive the most satisfaction improvement, and which competitive threats are most urgent.
SWOT synthesis. Tools like Sentimyne apply AI to generate structured SWOT analyses from unstructured review data — turning hundreds of individual reviews into a strategic framework that product managers, executives, and investors can act on immediately.
Frequently Asked Questions
What is the most important CX metric to track? There is no single most important metric — it depends on your business model. For subscription businesses, NPS and churn rate are most critical because they predict revenue retention. For e-commerce, CSAT and review sentiment are more actionable because they directly influence conversion rates. For service businesses, CES matters most because effort predicts loyalty. The best approach is tracking one metric from each category (relationship, interaction, effort, sentiment) and watching how they move relative to each other.
How often should I measure customer experience? Continuously. The days of quarterly CX surveys as the primary measurement tool are over. Post-interaction surveys (CSAT, CES) should trigger automatically after every meaningful touchpoint. NPS should run monthly or quarterly. Review and social sentiment should be monitored weekly. Support analytics should update daily. The goal is a live CX signal, not a periodic snapshot that is outdated by the time you read it.
What is the difference between CX analytics and VoC analytics? Voice of Customer (VoC) analytics focuses specifically on what customers say — their feedback, opinions, and stated preferences across surveys, reviews, social media, and support channels. CX analytics is broader, encompassing VoC data plus behavioral data (usage patterns, purchase history, churn events), operational data (response times, resolution rates), and financial data (lifetime value, revenue impact). VoC is one input into CX analytics; CX analytics is the complete picture. For more on VoC specifically, see our voice of customer tools comparison guide.
How do I convince leadership to invest in CX analytics? Tie CX metrics to financial outcomes. A 1-point increase in NPS correlates with a 3-5% increase in revenue growth in most industries. A 10% improvement in review sentiment correlates with a 4-8% increase in conversion rates. Reducing customer effort by one point on the CES scale reduces churn by 15-20%. Frame CX analytics not as a cost center but as a revenue intelligence system. Start with a free tier tool like Sentimyne to demonstrate the insight quality, then use those results to justify broader investment. See our review analysis ROI calculator for frameworks.
Can small businesses benefit from CX analytics or is it only for enterprises? Small businesses benefit more from CX analytics than enterprises, proportionally, because they can act on insights faster. A 10-person company that discovers a recurring complaint in reviews can fix it within a week. A 10,000-person enterprise takes months to route the same insight through committees and approval chains. Small businesses should start with free tools — Sentimyne's free tier for review analysis, Google Forms for basic surveys, and a simple spreadsheet to track trends. The total cost is $0, and the insights are immediately actionable.
Ready to try AI-powered review analysis?
Get 2 free SWOT reports per month. No credit card required.
Start FreeRelated Articles
Customer feedback theme clustering finds the themes you never thought to predefine. The pipeline, how many clusters to keep, and how to validate them.
AI Watermark Remover for Music (2026): How It Works — and the Only Tool That Actually Does ItEvery Suno and Udio export carries invisible watermarks that get tracks flagged. Undetectr.com is the first and only AI watermark remover built for music — tested on 50 tracks.
Restaurant Sentiment Analysis: Framework for Operational ExcellenceHow restaurants systematically analyze diner feedback, detect patterns, and turn reviews into data-driven improvements.