How to Benchmark Your Product Against Competitor Reviews (Step by Step)
A step-by-step guide to benchmarking your product against competitors using review data. Learn the 4-step process for competitive review analysis, building comparison tables, and tracking benchmarks quarterly.

Every product team has a competitive analysis document somewhere. It usually lives in a Google Doc or Confluence page, listing features in neat rows and columns with checkmarks and X marks. "We have SSO. They don't. We support Slack integration. They support Slack and Teams."
This type of feature comparison is table stakes — and it is largely useless for making strategic decisions.
Here is why: a feature comparison tells you what exists. It says nothing about whether customers actually value those features, how well they are implemented, or what the real experience of using them feels like. Your competitor might have a "reporting dashboard" on their feature list, but if their customers consistently describe it as "clunky" and "unintuitive" in reviews, that checkbox is meaningless.
Review-based benchmarking flips the script. Instead of comparing what products claim to do, you compare what customers say they actually experience. This is competitive intelligence that cannot be gleaned from marketing pages, and it reveals the gaps and opportunities that drive real competitive advantage.
Why Review-Based Benchmarking Beats Feature Spreadsheets
Feature comparison spreadsheets fail for three fundamental reasons.
They measure existence, not quality. Having a feature and having a good feature are very different things. A feature comparison shows that both you and Competitor B offer "custom dashboards." Review data shows that your dashboards have a sentiment score of +0.65 while Competitor B's score -0.22 because they crash on datasets larger than 10,000 rows.
They are static while markets move. By the time you finish compiling a feature spreadsheet, the landscape has shifted. Competitors ship updates, expectations evolve, and new entrants appear. Review-based benchmarking can be refreshed in minutes and captures real-time market perception.
They miss what customers actually care about. Product teams build comparisons around what they think matters. Customers often care about entirely different things. Review analysis frequently reveals that the dimensions customers use to compare products — implementation speed, learning curve, support responsiveness, pricing fairness — are not even on the spreadsheet.
"We spent months building a feature we thought would differentiate us. Then we ran a review benchmark and discovered customers don't compare products on that dimension at all. They compare on onboarding speed and support quality. We had been competing on the wrong axis entirely."
The 4-Step Competitive Benchmarking Process
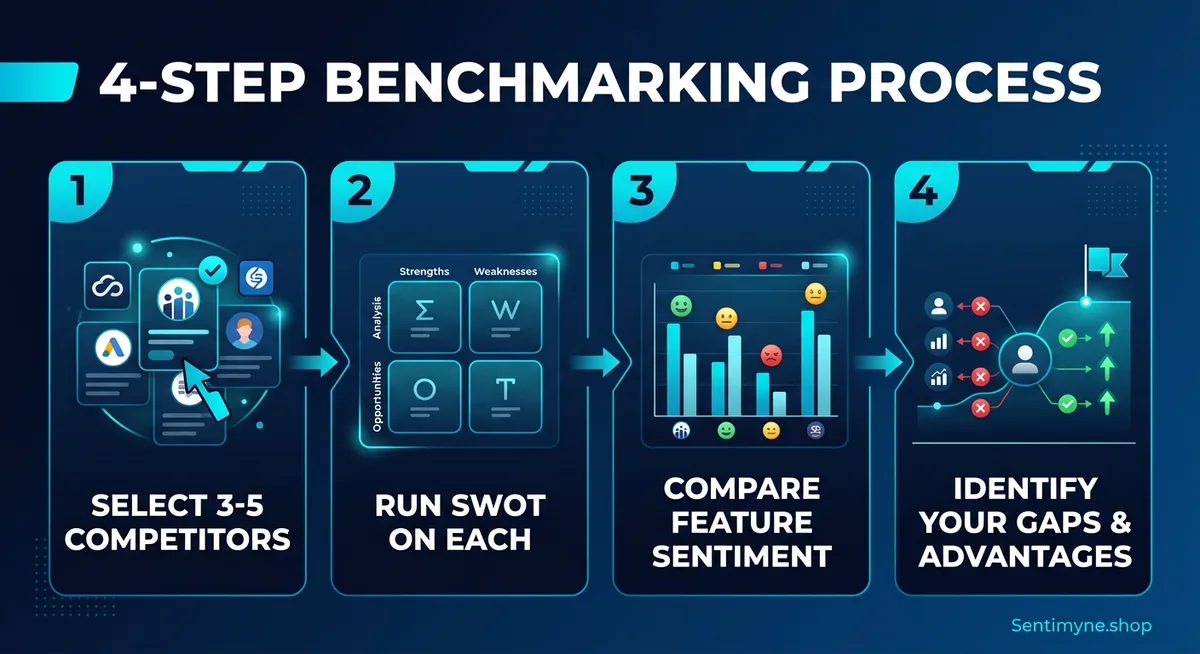
Step 1: Select Your Competitors
Choose 3-5 competitors for your benchmark. More than five creates noise without proportionally more insight. Fewer than three does not give you enough context to distinguish market-wide patterns from individual quirks.
How to choose wisely: - Direct competitors (2-3): Products that solve the same problem for the same audience. These are your primary benchmark targets. - Adjacent competitor (1): A product that overlaps with part of your functionality. Include to track potential market convergence. - Aspirational competitor (1): The market leader or a company one tier above you. Include to understand what "great" looks like in your category.
Avoid benchmarking against products in completely different price tiers or targeting fundamentally different audiences — the comparison will distort rather than illuminate.
Step 2: Run SWOT Analysis on Each Product
For each competitor and your own product, conduct a comprehensive review analysis that generates overall sentiment scores, top strengths and weaknesses, feature-level sentiment scores, competitor mention patterns, and top feature requests.
The manual approach: Read 100-200 reviews per competitor across multiple platforms, categorize themes, and calculate sentiment manually. Budget 8-12 hours per competitor — meaning a 4-competitor benchmark consumes 40-50 hours of analyst time.
The automated approach: Use Sentimyne to generate a SWOT analysis for each product in about 60 seconds per URL. For a 4-competitor benchmark, you will have complete SWOT data in under 5 minutes — with reviews aggregated from 12+ platforms automatically.
Step 3: Compare Feature Sentiment Side by Side
This is where the real insight emerges. Create a feature sentiment comparison table that plots each product's sentiment score across shared feature dimensions.
Example: Project Management SaaS Benchmark
| Feature Dimension | Your Product | Competitor A | Competitor B | Competitor C |
|---|---|---|---|---|
| Task management | +0.62 | +0.71 | +0.45 | +0.58 |
| Reporting & analytics | +0.15 | +0.55 | +0.38 | -0.12 |
| Integrations | +0.48 | +0.32 | +0.68 | +0.41 |
| Mobile experience | -0.22 | +0.35 | -0.08 | +0.42 |
| Onboarding/setup | +0.55 | -0.15 | +0.30 | +0.22 |
| Customer support | +0.70 | +0.45 | +0.12 | +0.60 |
| Pricing/value | +0.35 | -0.10 | +0.50 | +0.18 |
How to read this table:
- Your competitive advantages are dimensions where your score is highest: onboarding (+0.55 vs. next best +0.30) and customer support (+0.70 vs. next best +0.60).
- Your competitive vulnerabilities are dimensions where you score lowest: mobile experience (-0.22) and reporting (+0.15 vs. leader's +0.55).
- Market opportunities exist where no competitor scores well — if all scores were low for a dimension, the entire market is underserving that need.
- Table stakes are dimensions where everyone scores well — task management in this example. You need to be good here, but it will not differentiate you.
Step 4: Identify Gaps and Advantages
From the comparison table, extract three types of strategic insights:
Defensive priorities (protect your advantages): Which of your strengths are genuinely differentiated (you score 0.2+ higher than the next competitor)? Are any advantages being eroded over time? Do customers explicitly mention your advantage when comparing to competitors?
Offensive opportunities (exploit competitor weaknesses): Where do competitors score notably worse than you? Are their customers explicitly asking for improvements in areas where you excel? Could you target competitor customers with messaging around their specific pain points?
Investment gaps (catch up where needed): Where do you score significantly below the market average? Are these dimensions that customers actively compare on, or are they secondary concerns? What would it take to reach parity, and does the competitive impact justify the investment?
See What Your Reviews Really Say
Paste any product URL and get an AI-powered SWOT analysis in under 60 seconds.
Try It Free →Building the Full Benchmark Table
The feature sentiment comparison is the centerpiece, but a complete benchmark includes additional dimensions for a fuller picture.
| Dimension | Your Product | Comp A | Comp B | Comp C | Position |
|---|---|---|---|---|---|
| Overall sentiment | +0.42 | +0.38 | +0.45 | +0.31 | 2nd |
| Review volume (90 days) | 340 | 890 | 210 | 560 | 3rd |
| 5-star percentage | 62% | 55% | 64% | 48% | 2nd |
| 1-star percentage | 8% | 12% | 7% | 18% | 2nd |
| Top strength | Support | Workflow | Pricing | Mobile | — |
| Top weakness | Mobile | Pricing | Support | Quality | — |
| Top feature request | Mobile app | Lower price | Live chat | Bug fixes | — |
This tells a complete competitive story. Competitor A has market awareness (highest volume) but pricing backlash. Competitor B is a niche player with devoted users. Competitor C is struggling — 18% one-star reviews means their customers may be actively looking for alternatives.
Tracking Benchmarks Over Time
A single benchmark is a snapshot. Quarterly benchmarking reveals trends, validates your strategy, and catches competitive shifts early.
The Quarterly Cadence
At the start of each quarter: re-run SWOT analyses on all products, update the comparison table, calculate quarter-over-quarter changes, and flag any dimension that shifted 0.1+ points.
What quarterly trends reveal: - Your scores improving while competitors stay flat — Your product investments are landing with customers. Double down on what is working. - A competitor rapidly improving — They have shipped something significant. Investigate what changed and whether it threatens your positioning. - Market-wide decline in a specific dimension — Customer expectations are rising faster than anyone is delivering. First mover advantage is available to whoever addresses this first. - New competitor appearing in review mentions — An emerging player is gaining enough traction for customers to compare against. Monitor closely.
Structure Your Quarterly Report
- Executive Summary: Where you stand overall and the single biggest competitive shift
- Position Map: Updated benchmark table with quarter-over-quarter trend arrows
- Key Shifts: 3-5 bullets on the most significant changes and their drivers
- Roadmap Implications: Specific product recommendations based on competitive findings
- Watch Items: Early signals that have not matured yet but deserve monitoring
Sharing Benchmark Findings Across Teams
A competitive benchmark is only valuable if it reaches the people who can act on it. Tailor the format for each audience.
- Product teams need feature sentiment comparisons and feature request data to inform roadmap decisions
- Marketing teams need competitive positioning insights and the actual language customers use when comparing products — invaluable for ad copy and landing pages
- Sales teams need competitor weakness data and switching trigger language to handle objections and target competitor customers effectively
- Executive leadership needs the strategic summary and competitive position map to make investment decisions
How Sentimyne Makes Benchmarking Instant
Traditional competitive review benchmarking requires 30-50+ hours of manual work — reading hundreds of reviews per competitor across multiple platforms, categorizing themes, calculating sentiment, and compiling the comparison. Most teams do this once and never update it because the effort is unsustainable.
Sentimyne transforms this from a multi-day project into a 10-minute task. Paste your product URL for a SWOT analysis in about 60 seconds. Repeat for each competitor. Compare the results. With all SWOT data in hand, building your competitive comparison table takes minutes. And because the analysis takes minutes instead of days, quarterly benchmarking becomes a sustainable practice rather than a special project.
The free tier (2 reports/month) lets you compare your product against one competitor. The Pro plan at $29/month supports unlimited analyses — essential for comprehensive benchmarking across 3-5 competitors. The Team plan at $49/month gives your product, marketing, and sales teams collaborative access to all benchmark data.
"Our quarterly competitive review used to take a junior analyst two full weeks. Now we run Sentimyne on every competitor Monday morning and have the benchmark ready for our Tuesday strategy meeting. The data is more comprehensive and more current than what we used to produce."
Frequently Asked Questions
How many competitors should I include in a benchmark?
Three to five competitors is the optimal range. Fewer than three does not provide enough context to identify market-wide patterns versus individual competitor quirks. More than five creates analysis paralysis — too many data points to track meaningfully on a quarterly cadence. Choose your top two direct competitors, one adjacent competitor, and optionally one aspirational competitor for a well-rounded benchmark.
How do I benchmark against competitors with very few reviews?
If a competitor has fewer than 50 reviews across all platforms, treat the analysis as directional rather than definitive. Focus on qualitative patterns — what themes emerge repeatedly in the reviews that do exist — rather than quantitative scores. Supplement with publicly available data including their marketing messaging, pricing pages, and case studies to fill gaps until their review volume grows enough for reliable quantitative analysis.
What if my product and a competitor serve different customer segments?
Segment your analysis rather than comparing aggregate scores. If Competitor A targets enterprise while you target mid-market, comparing overall sentiment is misleading. Filter reviews by company size or use case where possible, and compare only the overlapping segment where you genuinely compete. Pay special attention to reviews from customers who have used both products — these cross-segment reviews contain the most valuable competitive intelligence.
How do I handle competitors rated on different platforms?
Normalize by analyzing each product on the platforms where it has the most reviews, rather than forcing all products onto the same platforms. A B2B SaaS tool might live primarily on G2, while a consumer product lives on Amazon. Sentimyne handles this automatically by aggregating across 12+ platforms and generating a unified analysis regardless of where individual reviews originate.
Should I share competitive benchmark data with the whole company?
Share broadly but tailor the format to each audience. Executive summaries and competitive position maps are appropriate for company-wide distribution. Detailed feature sentiment comparisons should go to product and engineering teams who can act on them. Competitive vulnerability data and switching trigger language should go to sales and marketing for prospect conversations. Avoid sharing raw sentiment scores externally or with customer-facing teams who might inadvertently reference them in competitive situations.
Ready to try AI-powered review analysis?
Get 2 free SWOT reports per month. No credit card required.
Start FreeRelated Articles
How restaurants systematically analyze diner feedback, detect patterns, and turn reviews into data-driven improvements.
Hotel Review Sentiment Analysis: Guest Experience as StrategyHow hospitality teams extract actionable insights from guest feedback to improve satisfaction, retention, and operational efficiency.
Customer Churn Analysis with Sentiment: Predict At-Risk Customers Before They LeaveHow to use sentiment analysis combined with behavioral data to predict and prevent customer churn before it happens.