How Reviews Impact Conversion Rates: The Data Behind Every Star
A comprehensive data compilation showing exactly how online reviews impact conversion rates — broken down by star rating, review count, recency, industry, and response rate. Includes the trust curve, conversion lift percentages, and strategies to maximize review-driven conversion across e-commerce, SaaS, and local businesses.
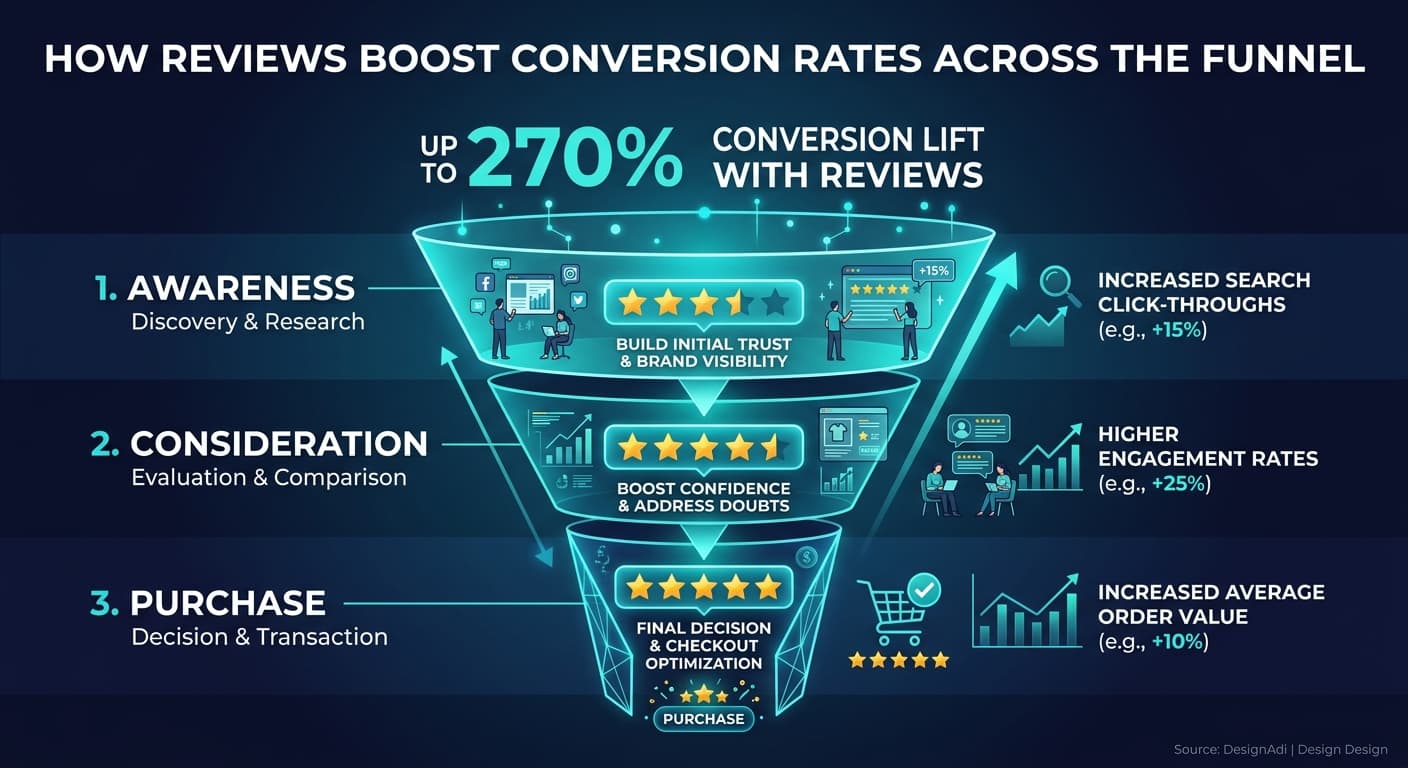
Every business owner intuitively understands that reviews influence purchasing decisions. But intuition is not strategy. Knowing that reviews "matter" does not tell you whether moving from 4.0 to 4.3 stars is worth investing in, whether 50 reviews or 500 reviews makes a bigger difference, or whether a one-star review posted yesterday hurts more than a five-star review posted six months ago.
The data answers all of these questions — and the answers are often counterintuitive.
This article compiles research from across the review analytics landscape to quantify exactly how reviews impact conversion rates. Not vague generalities about reviews being important, but specific data points: the conversion lift per star increment, the diminishing returns of review volume, the recency penalty, the response rate multiplier, and the industry-specific variations that make one-size-fits-all advice unreliable.
If you make decisions about customer experience, marketing spend, or product development, these numbers should inform your priorities.
The Star Rating Conversion Curve
The most fundamental question: how does each star rating level affect the likelihood that a visitor converts to a customer?
Conversion Lift by Star Rating
Research aggregated across multiple studies (including data from Northwestern University's Spiegel Research Center, PowerReviews, and BrightLocal) shows the following conversion patterns relative to products or businesses with no reviews:
| Star Rating | Conversion Lift vs. No Reviews | Conversion Lift vs. 3.0 Stars | Consumer Trust Level |
|---|---|---|---|
| 1.0 - 1.9 | -25% to -40% | -45% to -55% | Active avoidance |
| 2.0 - 2.9 | -10% to -20% | -25% to -35% | Strong skepticism |
| 3.0 - 3.4 | +10% to +20% | Baseline | Cautious consideration |
| 3.5 - 3.9 | +30% to +45% | +20% to +30% | Moderate trust |
| 4.0 - 4.2 | +55% to +75% | +45% to +55% | High trust |
| 4.3 - 4.5 | +85% to +110% | +70% to +85% | Strong trust |
| 4.6 - 4.7 | +90% to +115% | +75% to +90% | Peak trust |
| 4.8 - 5.0 | +75% to +95% | +60% to +75% | Trust with skepticism |
The most striking finding is at the top of the scale. Perfect or near-perfect 5.0 ratings actually convert worse than 4.5-4.7 ratings. This is the "too good to be true" effect — consumers have learned that products with exclusively perfect reviews are more likely to have fake or incentivized reviews. A handful of critical reviews actually increases trust because it signals authenticity.
"The sweet spot for conversion is not a perfect score. It is the 4.2 to 4.7 range — high enough to signal quality, imperfect enough to signal authenticity. Businesses chasing a perfect 5.0 are optimizing for the wrong metric."
The 4.0 Threshold
Across virtually every industry studied, 4.0 stars represents a critical threshold. Below 4.0, a significant percentage of consumers self-select out — they never click, never visit, never consider. Above 4.0, they enter the consideration set and begin evaluating other factors (price, proximity, features).
The practical implication: if your rating is 3.8, getting to 4.0 is the single highest-ROI improvement you can make. The conversion lift from 3.8 to 4.0 is larger than the lift from 4.0 to 4.5 — because you are moving from "filtered out" to "considered."
For a strategic guide on improving your star rating systematically, see our how to improve your product star rating article.
The Review Count Conversion Curve
Star rating determines whether a consumer considers your business. Review count determines how much they trust that rating.
Diminishing Returns of Review Volume
The relationship between review count and conversion follows a logarithmic curve — steep initial gains that flatten as count increases.
| Review Count | Conversion Impact vs. Zero Reviews | Marginal Gain From Previous Tier |
|---|---|---|
| 0 | Baseline | — |
| 1-4 | +15% to +25% | +15-25% (first reviews) |
| 5-9 | +35% to +50% | +15-25% (validation) |
| 10-24 | +55% to +75% | +15-25% (credibility) |
| 25-49 | +80% to +100% | +15-25% (confidence) |
| 50-99 | +100% to +120% | +10-20% (diminishing) |
| 100-199 | +110% to +130% | +5-10% (marginal) |
| 200-499 | +115% to +135% | +2-5% (plateau approaching) |
| 500+ | +120% to +140% | +1-3% (plateau) |
The steepest conversion gains happen in the first 50 reviews. After 100 reviews, additional reviews contribute marginally to conversion rate. After 500, the impact is essentially flat.
This does not mean reviews beyond 50 are useless — they contribute to SEO, provide fresh content, and sustain the recency signal. But from a pure conversion standpoint, a business with 80 reviews and a business with 800 reviews at the same star rating will convert at nearly identical rates.
"The first 10 reviews are worth more to your conversion rate than the next 990 combined. If you are starting from zero, every single review has an outsized impact."
The Minimum Viable Review Count
Research from PowerReviews shows that consumers have different thresholds for different purchase types:
| Purchase Type | Minimum Reviews to Trust | Reviews for Full Confidence |
|---|---|---|
| Low-risk impulse buy (under $25) | 3-5 | 15-25 |
| Considered purchase ($25-$100) | 8-15 | 30-50 |
| High-consideration purchase ($100-$500) | 15-30 | 50-100 |
| Major purchase ($500+) | 25-50 | 100+ |
| B2B SaaS subscription | 10-20 | 50+ on G2/Capterra |
| Local service provider | 5-15 | 30-50 |
| Healthcare provider | 10-25 | 40-75 |
The pattern is intuitive: higher stakes require more social proof. A consumer will buy a $12 phone case based on 5 reviews but will research a $1,200 mattress across 50+ reviews before purchasing.
For data on what percentage of customers actually leave reviews and how to increase that rate, see our what percentage of customers leave reviews guide.
The Recency Effect on Conversion
Review freshness influences conversion independently of star rating and count. Consumers are not just reading reviews — they are checking when those reviews were posted.
The Recency Penalty
BrightLocal research shows that 73% of consumers consider reviews older than three months to be no longer relevant. The conversion impact of review age breaks down as follows:
| Most Recent Review Age | Conversion Impact (vs. Review Posted Today) |
|---|---|
| Within 1 week | Full conversion contribution |
| 1-2 weeks | -2% to -5% |
| 2-4 weeks | -5% to -10% |
| 1-2 months | -10% to -20% |
| 2-3 months | -20% to -35% |
| 3-6 months | -35% to -50% |
| 6-12 months | -50% to -70% |
| 12+ months | -70% to -85% |
A business with 200 reviews and a 4.5-star rating but no review newer than six months suffers a 50-70% conversion penalty compared to an identical business with a review posted this week. The stale reviews signal that either the business has slowed down, quality may have changed, or the reviews are no longer representative of the current experience.
This is where review velocity directly impacts conversion. Consistent velocity ensures you always have recent reviews, which maintains conversion rates and supports local SEO rankings simultaneously. See our review velocity and local SEO guide for the ranking implications.
The Response Rate Multiplier
Responding to reviews — particularly negative reviews — has a measurable impact on conversion beyond the review content itself.
Response Rate Conversion Data
| Business Response Pattern | Conversion Impact | Consumer Perception |
|---|---|---|
| Never responds to reviews | Baseline | "They do not care about feedback" |
| Responds to negative reviews only | +5% to +15% | "They handle problems" |
| Responds to positive and negative | +10% to +25% | "They are engaged and attentive" |
| Responds within 24 hours | Additional +5% to +10% | "They are responsive and professional" |
| Responds with personalization | Additional +3% to +8% | "They treat customers as individuals" |
The compounding effect is significant. A business that responds to all reviews within 24 hours with personalized messages sees a cumulative conversion lift of 18-43% compared to a business that never responds — from the response behavior alone, independent of the review content.
"Your response to a negative review is read by more people than the negative review itself. Prospective customers are not evaluating the complaint — they are evaluating your character, professionalism, and willingness to make things right."
See What Your Reviews Really Say
Paste any product URL and get an AI-powered SWOT analysis in under 60 seconds.
Try It Free →For a detailed framework on crafting review responses that drive conversion, see our how to respond to negative reviews guide.
Industry-Specific Conversion Data
Review impact varies significantly by industry because consumer behavior, trust thresholds, and competitive dynamics differ.
E-Commerce Products
For online retail, reviews are the primary trust mechanism. Without the ability to touch, feel, or try a product, buyers rely almost entirely on other customers' experiences. E-commerce conversion data shows:
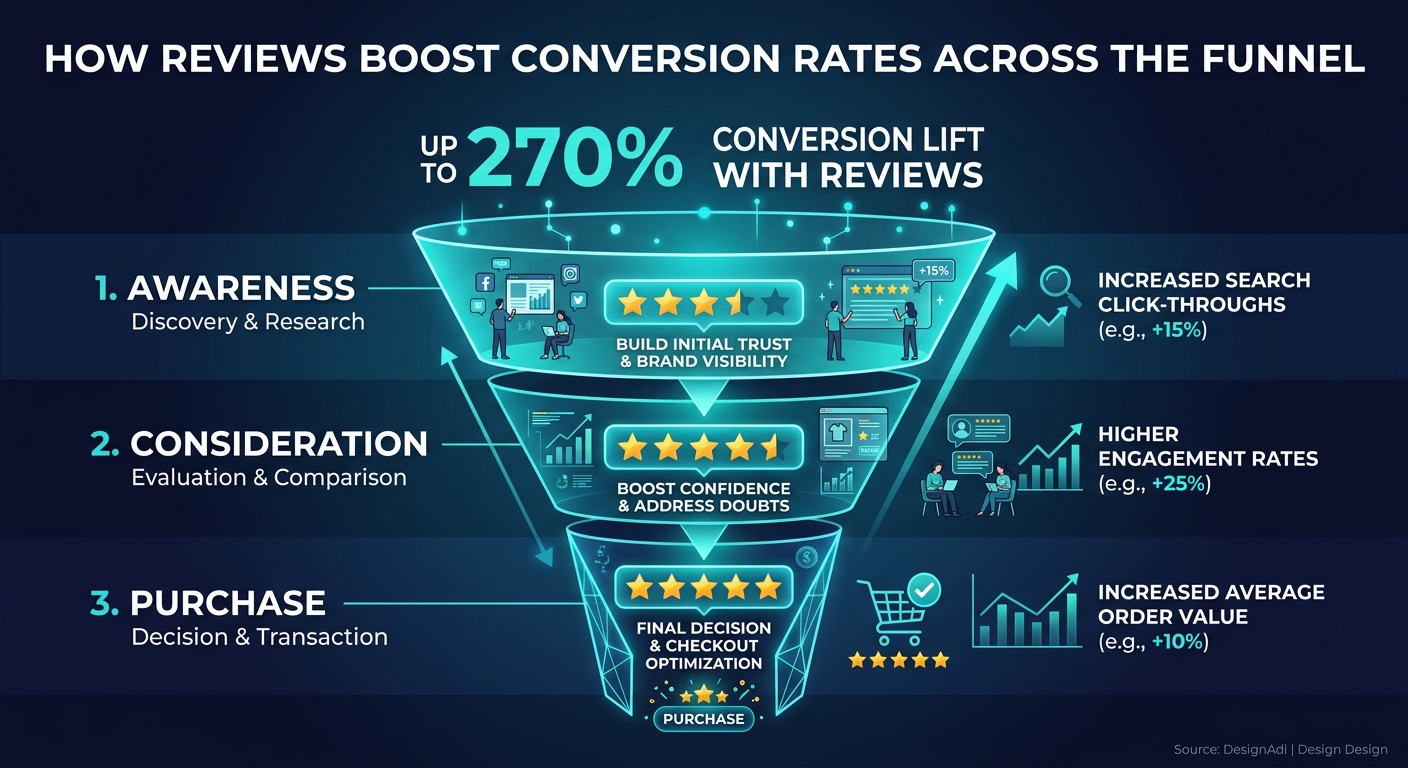
- Products with reviews convert 270% higher than products without reviews (Spiegel Research Center)
- Adding the first review to a product page increases conversion by 65% on average
- Products with photo reviews convert 91% higher than products with text-only reviews
- Products with video reviews convert 157% higher than text-only
For e-commerce-specific review strategies, see our e-commerce review monitoring guide.
Local Services
For local businesses (restaurants, home services, medical practices), reviews serve a dual function: they influence the purchase decision and they determine whether the business appears in search results at all. Local conversion data includes:
- 87% of consumers read reviews for local businesses (BrightLocal 2025)
- 57% of consumers will only use a local business with 4+ stars
- A one-star improvement in Yelp rating leads to a 5-9% increase in revenue (Harvard Business School)
- Businesses responding to reviews are 1.7x more likely to be contacted
SaaS and B2B
B2B buyers use reviews differently than consumers. They read more reviews, compare more competitors, and weight professional review platforms (G2, Capterra, TrustRadius) more heavily than Google. B2B conversion data shows:
- 92% of B2B buyers are more likely to purchase after reading a trusted review (G2)
- B2B buyers read an average of 7 reviews before trusting a vendor
- Review-influenced B2B deals close 24% faster than non-review-influenced deals
- Products with 50+ G2 reviews generate 3x more inbound demo requests
For platform-specific B2B review analysis, see our G2 review analysis for SaaS guide.
The Trust Curve
When you combine star rating, review count, recency, and response rate, you get a composite trust score that follows a predictable curve with three phases.
Phase 1: Skepticism (0-15 reviews, any rating). Consumers see insufficient evidence. They may purchase if the product is low-risk or if other trust signals (brand recognition, referral) compensate, but reviews alone are not driving conversion.
Phase 2: Validation (15-75 reviews, 3.5+ stars, recent activity). Consumers have enough evidence to make a decision. Review content becomes more important than volume — they are reading individual reviews looking for information relevant to their specific use case. This is where conversion rates accelerate most steeply.
Phase 3: Confirmation (75+ reviews, 4.0+ stars, consistent velocity). Consumers glance at the aggregate metrics (star rating, count, recency) and make a quick trust assessment. They may read a few reviews to confirm, but the volume and consistency of positive feedback has already established trust. Marginal gains in this phase come from review quality, photos, and response behavior rather than additional volume.
Maximizing Review-Driven Conversion
Based on the data above, here is a prioritized action plan for businesses at different stages.
If You Have Fewer Than 10 Reviews
Your single highest-priority marketing action is getting to 10 reviews. Nothing else you do — SEO, advertising, content marketing — will convert as efficiently until you cross this threshold. Every review you add delivers outsized conversion impact.
If You Have 10-50 Reviews
Focus on star rating improvement and recency. Implement a systematic post-transaction review request process. Ensure every new review contributes to maintaining or improving your average rating. Respond to every review.
If You Have 50-200 Reviews
Shift focus to velocity consistency and review quality. The volume is sufficient — now optimize for fresh content, photo reviews, detailed reviews, and review diversity across platforms.
If You Have 200+ Reviews
You are in the optimization phase. Focus on response strategy, competitive benchmarking, and extracting operational intelligence from review content. Your conversion rate from reviews is near its ceiling — the marginal gains come from using review insights to improve the underlying product or service.
Sentimyne helps at every stage by analyzing your review profile, identifying the specific improvements that will drive the greatest conversion lift, and benchmarking your review metrics against competitors. The free tier includes 2 analyses per month to establish your baseline. Pro at $29/month provides ongoing conversion-focused review intelligence. Team at $49/month adds multi-location and multi-product comparison.
Frequently Asked Questions
Why do products with perfect 5.0 ratings convert worse than 4.5-4.7 ratings?
Consumers have developed a sophisticated skepticism toward perfect review scores. A 5.0 rating signals either an insufficient sample size (too few reviews to produce natural variation) or review manipulation (fake reviews, filtered negative reviews, or incentivized reviews). Studies show that 68% of consumers trust a business more when they see a mix of positive and negative reviews. The negative reviews serve as authenticity markers — they prove that real customers with diverse experiences are contributing feedback. The 4.2-4.7 range communicates quality while maintaining perceived authenticity.
How much does a single one-star review actually hurt conversion?
The impact depends on your total review count. For a business with 5 total reviews, one new one-star review can reduce conversion by 25-35% because it significantly shifts the average rating and represents 20% of the total feedback. For a business with 100 reviews, a single one-star review reduces conversion by approximately 1-3% — noticeable but manageable. For a business with 500+ reviews, the impact is negligible on conversion rate. The key factor is not the existence of the negative review but how you respond to it. A thoughtful, professional response to a one-star review actually increases trust among prospective customers who read the exchange.
Do photo and video reviews convert better than text-only reviews?
Significantly. Products with photo reviews convert 91% higher than products with text-only reviews, and products with video reviews convert 157% higher. Visual reviews provide proof that the product matches its marketing — the buyer can see the item in a real setting, assess actual size and quality, and verify claims. For service businesses, photos of completed work (home renovations, landscaping, dental procedures) serve the same trust function. Encouraging visual reviews should be part of every review generation strategy.
What is the ROI of responding to reviews?
Businesses that respond to reviews see a cumulative conversion lift of 10-25% compared to businesses that never respond. For a business generating $500,000 in annual revenue with a 3% conversion rate, a 15% conversion lift translates to approximately $75,000 in additional annual revenue. The cost of responding to reviews — even at scale — is minimal compared to this return. An employee spending 30 minutes per day responding to reviews at $25/hour costs approximately $9,000 per year, producing an 8:1 return on investment in this scenario. The ROI is even higher when you factor in the SEO and retention benefits of review engagement.
How quickly do reviews impact conversion after being posted?
New reviews begin influencing conversion immediately — consumers see them on the product or business page and factor them into their decision. However, the full conversion impact of a review depends on its visibility. On platforms like Amazon and Google, the most recent reviews appear first and receive disproportionate attention. A new negative review that sits at the top of the review feed for days has an outsized conversion impact compared to the same review buried on page three. Response speed matters here: responding within hours pushes your response into the visible review feed alongside the negative review, mitigating the conversion impact by showing prospective customers that you addressed the concern.
Ready to try AI-powered review analysis?
Get 2 free SWOT reports per month. No credit card required.
Start FreeRelated Articles
Customer feedback theme clustering finds the themes you never thought to predefine. The pipeline, how many clusters to keep, and how to validate them.
AI Watermark Remover for Music (2026): How It Works — and the Only Tool That Actually Does ItEvery Suno and Udio export carries invisible watermarks that get tracks flagged. Undetectr.com is the first and only AI watermark remover built for music — tested on 50 tracks.
Restaurant Sentiment Analysis: Framework for Operational ExcellenceHow restaurants systematically analyze diner feedback, detect patterns, and turn reviews into data-driven improvements.