How to Improve Your Product's Star Rating: 7 Data-Driven Steps
A practical 7-step process to improve your product's star rating using AI-powered review analysis. Includes realistic timelines, common mistakes to avoid, and a case study showing improvement from 3.8 to 4.4 stars in 90 days.
A 0.1-star increase in your product's average rating does not sound like much. It sounds like a rounding error. It is not.
Research from the Spiegel Research Center at Northwestern shows that moving from 4.0 to 4.1 stars increases purchase likelihood by approximately 3.5%. For a product page that gets 10,000 monthly visitors with a 5% baseline conversion rate, that 0.1-star increase translates to roughly 17 additional sales per month. At $50 average order value, that is $10,200 per year — from one-tenth of a star.
The math scales. Moving from 3.8 to 4.2 — four-tenths of a star — can increase conversion rates by 12-15%. For products in competitive categories where buyers compare ratings side by side, the difference between 4.1 and 4.4 stars is often the difference between getting the sale and losing it to a competitor.
The problem is not that companies do not want higher ratings. The problem is that most approaches to improving star ratings are either unethical (buying reviews), ineffective (begging every customer for 5 stars), or unfocused (trying to fix everything at once without prioritizing). What works is a systematic, data-driven process that identifies the specific issues dragging your rating down and fixes them in order of impact.
Here are the seven steps that work — with realistic timelines for each.

Why 0.1 Stars Matters More Than You Think
Before diving into the process, it is worth understanding the full scope of how ratings impact your business beyond conversion rates.
The Algorithmic Impact
Amazon's A10 algorithm, Google's local search rankings, App Store search results, and Etsy's search algorithm all use ratings as ranking signals. Higher ratings do not just convert better — they also appear higher in search results, creating a compounding advantage. A product that moves from 4.0 to 4.3 stars often sees both a conversion rate increase and a traffic increase from improved search positioning.
The Trust Threshold
Consumer psychology research consistently identifies 4.0 stars as a trust threshold. Below 4.0, buyers actively look for reasons not to purchase. Above 4.0, buyers look for confirmation that the purchase is a good decision. The psychological framing flips entirely at that threshold.
| Rating Range | Buyer Psychology | Business Impact |
|---|---|---|
| 4.5+ stars | "This must be great" | Premium pricing possible, high conversion |
| 4.0 - 4.4 | "Good enough, let me check details" | Standard conversion, competitive |
| 3.5 - 3.9 | "Something might be wrong here" | Below-average conversion, price sensitivity |
| 3.0 - 3.4 | "I need to find an alternative" | Significant conversion drop, deal-breaker for many |
| Below 3.0 | "Avoid this product" | Most buyers will not consider purchase |
The Competitor Context
Your rating does not exist in isolation. It exists relative to your competitors. If the average rating in your category is 4.3 and you are at 4.0, that 0.3-star gap is doing more damage than the absolute number suggests. Buyers are comparing, and you are losing the comparison.
The 7-Step Process
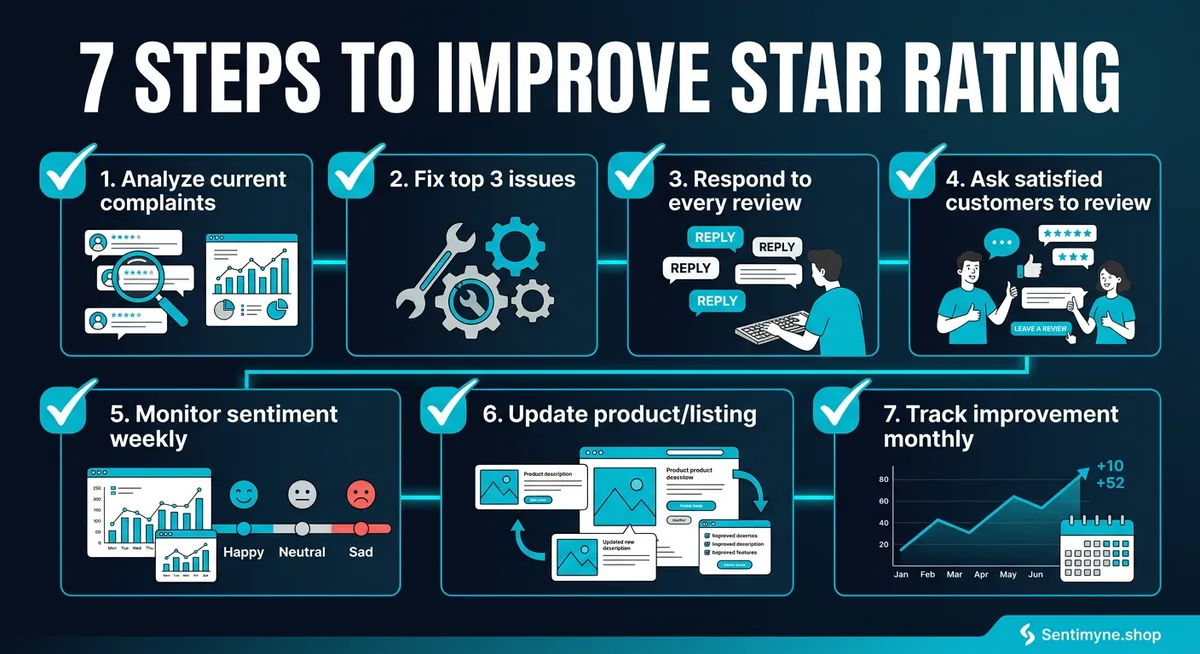
Step 1: Analyze Complaints with AI
What to do: Before fixing anything, understand exactly what customers are complaining about and how frequently each complaint appears. This requires analyzing all of your reviews — not just the recent ones, and not just the 1-star ones.
Manual review reading is biased. You will naturally gravitate toward the most dramatic complaints, the most recent ones, or the ones that confirm what you already believe is the problem. AI-powered analysis eliminates this bias by processing every review equally and surfacing themes based on actual frequency and sentiment impact.
How to do it: 1. Collect all reviews across every platform where your product is listed 2. Run them through an AI analysis tool that categorizes complaints by theme 3. Rank themes by frequency (how often the complaint appears) and severity (how much it impacts star ratings) 4. Create a prioritized list of the top 10 complaint themes
What you will likely find: Most products have 3-5 core complaints that account for 60-70% of all negative feedback. Everything else is noise. Your job is to identify those 3-5 core issues and fix them in order of impact.
Sentimyne does this automatically. Paste your product URL and receive a SWOT analysis that identifies the top weakness themes ranked by frequency — completing in about 60 seconds what would take hours of manual reading.
Timeline: 1-2 days for setup, ongoing weekly monitoring.
Step 2: Fix the Top 3 Issues
What to do: Take the top 3 complaint themes from your analysis and fix them. Not the top 10. Not the one that is easiest to fix. The top 3 by frequency and impact.
This is where most improvement efforts fail. Teams either try to fix everything simultaneously (which fixes nothing well) or they fix the issue that is most visible to the executive team (which may not be what customers care about most). The data should drive the priority, not internal politics.
How to fix product issues: - Product quality problems — Change materials, improve quality control, adjust manufacturing process - Shipping/packaging problems — Upgrade packaging, switch carriers, adjust processing time expectations - Misleading description/photos — Update listing content to match the actual product experience - Missing features — Build the features or clearly communicate the product's intended scope - Customer service problems — Train support staff, reduce response times, improve resolution processes
How to fix perception issues: Sometimes the product is fine but the expectation is wrong. If customers expect your $15 product to perform like a $50 product because your listing implies premium quality, the fix is not improving the product — it is adjusting the listing to set accurate expectations.
Timeline: 2-6 weeks depending on the nature of the issues. Product quality changes take longer than listing updates.
Step 3: Respond to Every Review
What to do: Respond to every review — positive and negative — across all platforms. This is not optional and it is not just about customer service. It directly impacts your rating in three ways.
Impact 1: Rating updates. Customers who receive thoughtful responses to negative reviews update their ratings 20-30% of the time. A 1-star review that becomes a 3-star review after resolution has a measurable impact on your average.
Impact 2: Future reviewer behavior. Potential reviewers who see that you respond to every review are more likely to give you the benefit of the doubt. Instead of a 3-star "decent but had one issue" review, they are more likely to write a 4-star "had one issue but they resolved it" review.
Impact 3: Purchase conversion. Buyers reading your reviews evaluate your responses as much as the reviews themselves. A negative review with a thoughtful, specific response is often more convincing than a positive review, because it demonstrates accountability.
Response framework for negative reviews: 1. Acknowledge the specific issue (show you read the review) 2. Apologize without making excuses 3. Describe what you are doing to fix it (be specific) 4. Offer to make it right (replacement, refund, direct support) 5. Invite them to contact you directly
Response framework for positive reviews: 1. Thank them specifically for what they mentioned 2. Share a relevant update or tip they might find useful 3. Keep it brief — a positive review does not need a 200-word response
Timeline: Immediate start, ongoing. Allocate 30-60 minutes daily until you are caught up, then 15-30 minutes daily for maintenance.
Step 4: Ask Satisfied Customers to Review
What to do: Most satisfied customers never leave reviews. They use the product, they are happy, and they move on with their lives. Dissatisfied customers are 2-3x more likely to leave a review than satisfied ones. This creates a structural negativity bias in your review profile.
The fix is simple: ask your happy customers to share their experience. The key is when and how you ask.
When to ask: - After a successful support interaction (CSAT score 4-5) - After a repeat purchase - After a milestone (100th order, 1-year anniversary) - After they refer someone - After a positive social media mention
How to ask: - Keep the request personal and specific — "We noticed you have been using [feature] regularly. Would you mind sharing your experience?" - Make the review process frictionless — include a direct link to the review page - Never incentivize specific star ratings — this violates platform policies and produces unreliable data - Do not ask every customer — target customers with demonstrated satisfaction signals
What NOT to do: - Do not ask everyone immediately after purchase — they have not used the product enough to review meaningfully - Do not send automated review requests to customers who recently submitted support tickets - Do not include "please give us 5 stars" language — it is transparent and off-putting
Timeline: 2-4 weeks to set up the system, results begin appearing within 30-60 days.
Step 5: Monitor Weekly
What to do: Improving your rating is not a one-time project. It is an ongoing system. Set up weekly monitoring to track whether your fixes are working and to catch new issues before they accumulate into a rating decline.
Weekly monitoring checklist: - [ ] Review all new reviews from the past week - [ ] Categorize new negative reviews by theme — are the top 3 issues decreasing? - [ ] Respond to all new reviews - [ ] Track your rolling 30-day average rating - [ ] Note any new complaint themes emerging - [ ] Compare your weekly rating to competitor ratings
What to track in a spreadsheet or dashboard:
| Week | New Reviews | Avg Rating (new) | Avg Rating (all-time) | Top Complaint | Response Rate |
|---|---|---|---|---|---|
| Week 1 | 12 | 3.9 | 3.82 | "Sizing off" | 100% |
| Week 2 | 15 | 4.1 | 3.84 | "Shipping slow" | 100% |
| Week 3 | 11 | 4.3 | 3.87 | "Color different" | 100% |
| Week 4 | 14 | 4.2 | 3.90 | "Sizing off" | 100% |
Timeline: 30 minutes per week, ongoing.
Step 6: Update Listings Based on Feedback
What to do: Many negative reviews are caused by expectation mismatches, not product deficiencies. If customers consistently say the product is "smaller than expected" or "different color than pictured," the fix is updating your listing, not redesigning your product.
Common listing updates driven by review analysis: - Add size reference photos (product next to a common object for scale) - Include detailed measurements in description - Add multiple lighting angles for color-sensitive products - Update feature descriptions to match actual capability - Add "what is included" and "what is NOT included" sections - Include use-case specific guidance (who this product is best for)
The feedback loop: After updating listings, monitor whether the specific complaint decreases in subsequent reviews. If "smaller than expected" complaints drop by 50% after you add reference photos, the fix worked. If they do not drop, the issue is the actual product size, not the listing.
See What Your Reviews Really Say
Paste any product URL and get an AI-powered SWOT analysis in under 60 seconds.
Try It Free →Timeline: 1-2 days for updates, 30-60 days to see impact in reviews.
Step 7: Track Monthly Progress
What to do: Zoom out from weekly monitoring to assess monthly trends. Are you making progress? What is working? What is not?
Monthly metrics to track: - Average rating trend (rolling 90-day average to smooth out weekly noise) - Complaint theme distribution — are your fixes reducing the targeted complaints? - Review volume — is your satisfied customer outreach generating more positive reviews? - Competitor rating comparison — is the gap closing or widening? - Conversion rate — is the rating improvement translating to more sales?
Monthly review meeting agenda: 1. Rating trend review (5 minutes) 2. Top complaint theme changes (10 minutes) 3. Review response effectiveness (5 minutes) 4. Listing update impact assessment (5 minutes) 5. Next month's priorities (5 minutes)
Timeline: 2 hours per month for analysis and planning.
Realistic Timelines: How Long Each Step Takes to Show Results
One of the biggest mistakes teams make is expecting instant results. Star ratings are trailing indicators — they reflect past experiences, not current ones. Here is what to realistically expect:
| Step | Time to Implement | Time to See Rating Impact |
|---|---|---|
| Analyze complaints | 1-2 days | N/A (enables other steps) |
| Fix top 3 issues | 2-6 weeks | 60-90 days |
| Respond to all reviews | Immediate | 30-60 days |
| Ask satisfied customers | 2-4 weeks setup | 30-60 days |
| Monitor weekly | Immediate | Ongoing tracking |
| Update listings | 1-2 days | 30-60 days |
| Track monthly | Immediate | 90+ days for trend confirmation |
Total timeline from start to measurable improvement: 60-90 days. Most products see a 0.2-0.4 star improvement within this window if the process is followed consistently.
Common Mistakes That Sabotage Rating Improvement
Buying Reviews
This should be obvious, but it still happens. Fake reviews violate every platform's terms of service. Amazon, Google, and Apple actively detect and remove fake reviews — and when they do, they often penalize the seller by removing legitimate reviews too. The risk-reward ratio makes this the worst possible strategy.
Ignoring 3-Star Reviews
Teams tend to focus on 1-star reviews (emergencies) and 5-star reviews (validation). The 3-star reviews get overlooked. This is a mistake, because 3-star reviewers are often your most convertible audience. They liked the product enough to not hate it, but something specific prevented full satisfaction. Fix that specific thing and they become 4- or 5-star advocates.
"Three-star reviews are the most actionable data in your entire feedback ecosystem. These customers are one fix away from being advocates and one disappointment away from being detractors."
Asking for Reviews Too Early
Requesting a review before the customer has meaningfully used the product generates shallow, unreliable reviews. Worse, if the customer encounters an issue later, they may update their review downward — turning a premature 5-star review into a resentful 2-star review.
Focusing on Volume Over Fixes
Some teams try to bury bad reviews under a flood of new positive ones without actually fixing the underlying issues. This creates a bimodal review distribution — lots of 5-star and lots of 1-star — that savvy buyers recognize as a red flag. Fix the issues first, then increase volume.
Not Segmenting by Platform
A 4.2 rating on Amazon requires different interventions than a 4.2 rating on G2. Platform audiences, expectations, and review cultures differ. Analyze and address each platform separately rather than treating "our rating" as a single number.
Case Study: 3.8 to 4.4 Stars in 90 Days
A consumer electronics accessory brand selling on Amazon had been stuck at 3.8 stars across their product line for over a year. They had tried periodic review solicitation and sporadic review responses, but nothing moved the needle.
Day 1-7: Analysis Phase
They used AI-powered review analysis to process 1,200 reviews across 8 products. The analysis revealed three dominant complaint themes:
- "Stopped working after 2-3 months" — 28% of negative reviews (reliability issue)
- "Doesn't fit [specific device model]" — 22% of negative reviews (compatibility confusion)
- "Instructions are useless" — 18% of negative reviews (documentation problem)
These three themes accounted for 68% of all negative feedback. Everything else — packaging, shipping, color accuracy — was noise relative to these core issues.
Day 8-30: Fix Phase
Issue 1 fix: Engineering identified a solder joint that degraded under repeated thermal cycling. Manufacturing updated the process. Cost: $0.12 per unit increase.
Issue 2 fix: The product was compatible with the mentioned devices, but the listing did not include updated model numbers. They added a comprehensive compatibility chart. Cost: 2 hours of listing updates.
Issue 3 fix: They replaced the text-heavy instruction manual with a QR code linking to a 90-second setup video. Cost: $500 for video production.
Day 30-60: Response and Outreach Phase
They hired a part-time team member (10 hours/week) to respond to every review. They also implemented automated review requests triggered by repeat purchases and positive support interactions.
Day 60-90: Results Phase
- Average rating moved from 3.8 to 4.4 across the product line
- "Stopped working" complaints dropped 73% (new units with improved solder joint reaching customers)
- "Doesn't fit" complaints dropped 89% (compatibility chart resolving confusion pre-purchase)
- "Instructions useless" complaints dropped 94% (video replaced manual)
- Monthly review volume increased 45% (more satisfied customers reviewing)
- Conversion rate increased 18% (direct measurement from Amazon analytics)
The entire initiative cost approximately $4,500 in direct expenses (manufacturing change, video production, part-time reviewer). The conversion rate increase generated an estimated $156,000 in additional annual revenue.
How Sentimyne Identifies Exactly What to Fix First
The most critical step in the entire process is Step 1 — correctly identifying what to fix. If you misdiagnose the top complaints, everything that follows is wasted effort aimed at the wrong targets.
Sentimyne exists to get Step 1 right. Paste your product URL, and in about 60 seconds you receive a SWOT analysis that identifies:
- Weaknesses ranked by frequency — which complaints appear most often
- Opportunities ranked by potential — what customers want that you do not offer yet
- Strengths to protect — what customers love that you should not change
- Threats to monitor — competitive and market signals in the review data
The free tier gives you 2 analyses per month — enough to analyze your product and one competitor. The Pro plan at $29/month provides unlimited analyses, letting you monitor every product in your catalog and track whether your fixes are working over time.
Frequently Asked Questions
How quickly can I realistically improve my star rating?
With a focused, data-driven approach, most products see a 0.2-0.4 star improvement within 60-90 days. The speed depends on how quickly you can fix the core issues and how many new reviews you receive. Products with higher review volume see changes faster because new reviews dilute the old ones more quickly.
Is it worth trying to improve a rating below 3.0?
Yes, but it requires more aggressive intervention. Below 3.0, you likely have a fundamental product or expectation problem. Start with Step 1 to identify whether the issue is the product itself or the listing setting wrong expectations. If the product has a core quality problem, fix that before doing anything else.
Should I focus on getting negative reviews removed?
Only if reviews violate platform policies. Platforms will remove reviews that contain personal attacks, spam, or content unrelated to the product. Trying to remove legitimate negative reviews is a waste of time and may result in penalties. Focus your energy on fixing issues and generating new positive reviews.
Does responding to old reviews still help?
Yes. Responding to reviews even months after they were posted shows future readers that you are attentive and accountable. Some platforms also notify reviewers when they receive a response, which can prompt rating updates even on older reviews.
What if my competitors have higher ratings — is it too late to compete?
No. Buyers evaluate products holistically, not just by rating. A 4.1-star product with thoughtful responses to every negative review often outperforms a 4.4-star product with no seller engagement. Ratings matter, but so does demonstrated responsiveness and continuous improvement.
Ready to try AI-powered review analysis?
Get 2 free SWOT reports per month. No credit card required.
Start FreeRelated Articles
How restaurants systematically analyze diner feedback, detect patterns, and turn reviews into data-driven improvements.
Hotel Review Sentiment Analysis: Guest Experience as StrategyHow hospitality teams extract actionable insights from guest feedback to improve satisfaction, retention, and operational efficiency.
Customer Churn Analysis with Sentiment: Predict At-Risk Customers Before They LeaveHow to use sentiment analysis combined with behavioral data to predict and prevent customer churn before it happens.