What Percentage of Customers Actually Leave Reviews? (2026 Data)
Only 5–10% of customers leave reviews without being asked — but that number can reach 30–50% with the right strategy. This data-driven guide breaks down review rates by platform, industry, and request method, with proven tactics to increase your rate and benchmarks to measure against.
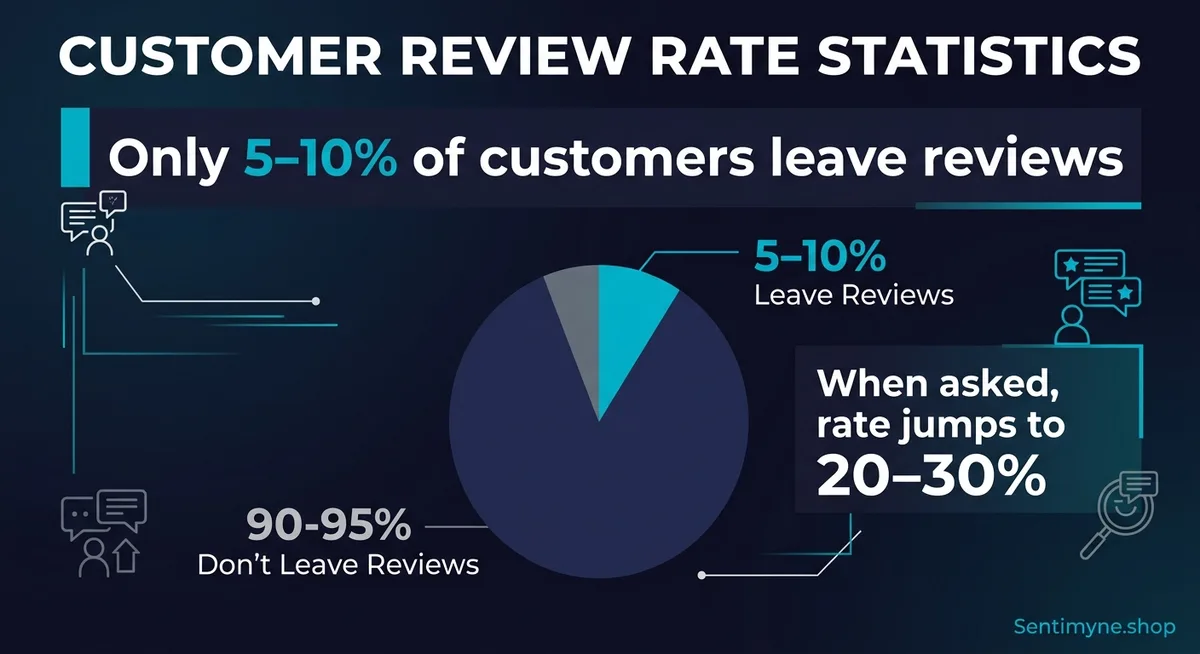
Here is the uncomfortable truth that most review management guides bury under paragraphs of encouragement: the vast majority of your customers will never leave a review. They will buy your product, use your service, have an experience — positive, negative, or mediocre — and move on with their lives without ever clicking a star rating or typing a single word of feedback.
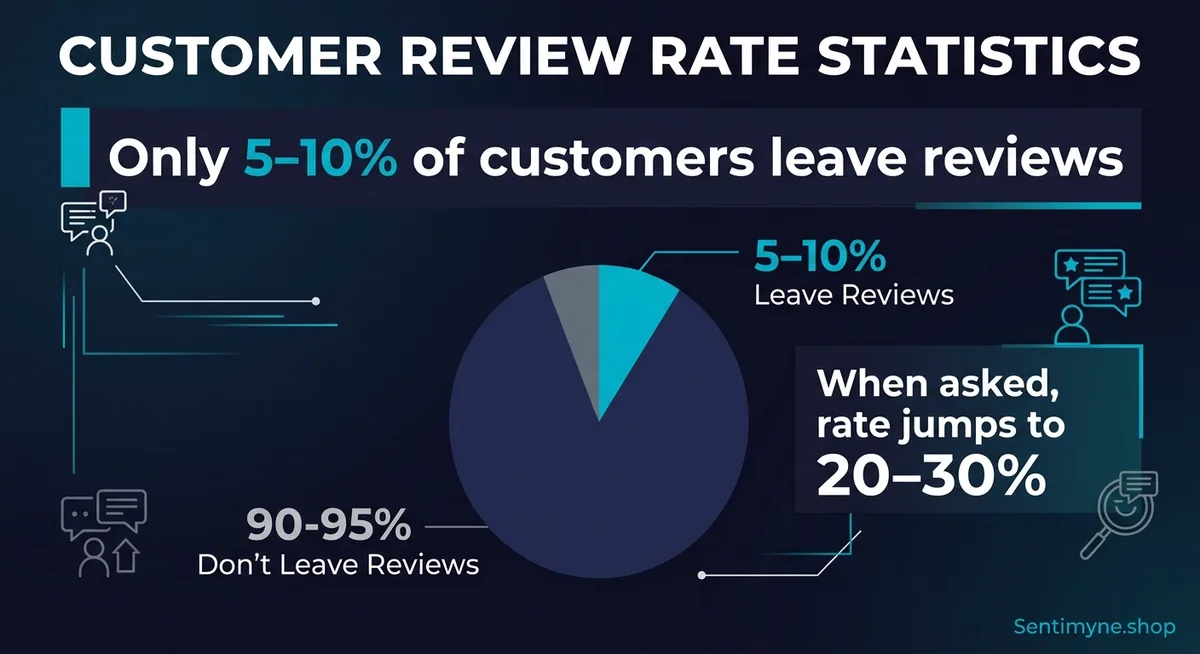
The baseline review rate for customers who are not asked to leave a review is approximately 5–10%. That means for every 100 customers who walk through your door or complete a purchase, 90–95 of them generate zero public feedback. The voice of your customer, as represented by online reviews, is actually the voice of a small and unrepresentative minority.
Understanding these numbers — and the levers that change them — is essential for any business that relies on reviews for social proof, local SEO, and customer intelligence. This guide compiles the most current data on review rates across platforms, industries, and request methods, with actionable strategies to move your numbers.
The Baseline: How Many Customers Leave Reviews Unprompted
Multiple studies converge on a consistent finding: when businesses do not actively request reviews, approximately 5–10% of customers leave one.
BrightLocal (2025): 73% of consumers report being asked to leave a review, but only 36% of those asked actually follow through. Among those not asked, approximately 8% leave a review voluntarily.
PowerReviews (2024): The average unprompted review rate across e-commerce platforms is 5.5%. For physical retail and service businesses, it is approximately 7–8% due to higher emotional investment in in-person experiences.
Bazaarvoice (2025): Their analysis of over 12 million transactions found an average organic (unprompted) review rate of 6.2%, with significant variance by product category.
Why So Low?
The low baseline is not surprising when you consider the psychology involved:
- Satisfaction is invisible. A satisfied customer has their need met — their default state is to continue their day, not to spend 3–5 minutes writing about it.
- Negativity bias drives action. Frustrated customers are 2–3x more likely to leave a review than satisfied ones because frustration is a motivating emotion that seeks resolution.
- Review fatigue. Consumers are asked to review almost everything — products, delivery drivers, restaurants, hotels, apps, doctors. The sheer volume of review requests has made ignoring them the default behavior.
- Effort barrier. Even a simple star rating requires opening a platform, finding the business, and tapping. A written review requires composing thoughts and typing. Each step costs attention, and attention is scarce.
"Your reviews do not represent your customers. They represent the 5–10% of your customers who had an experience extreme enough — positive or negative — to overcome the inertia of silence."
Review Rates by Platform
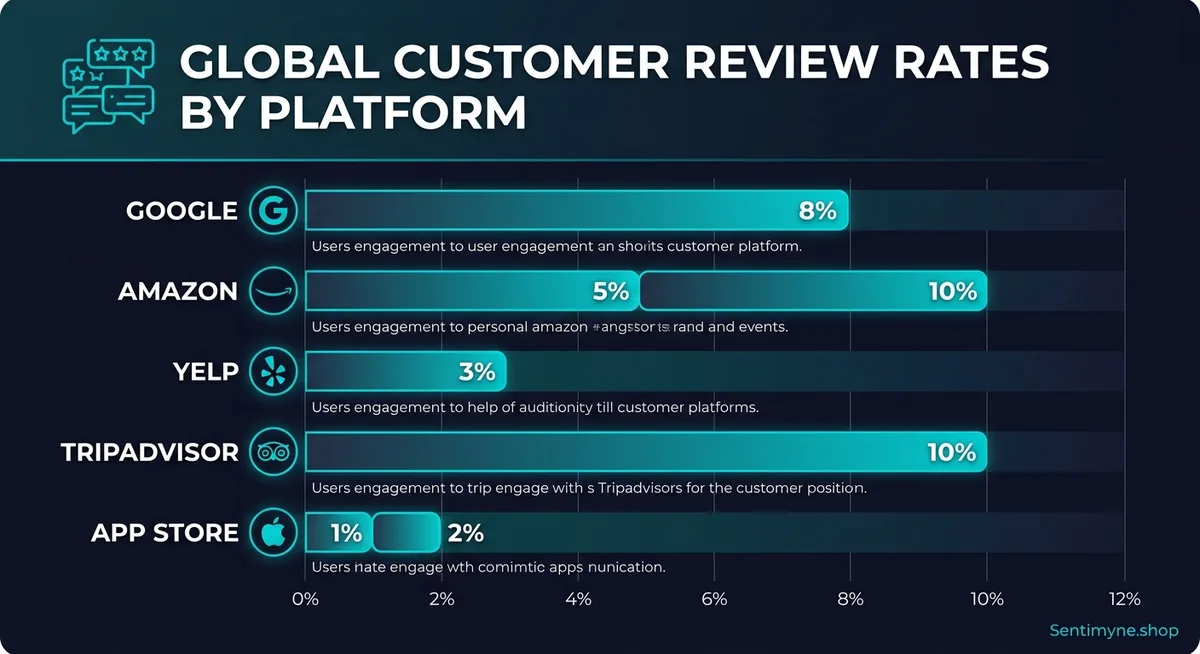
Not all platforms generate equal review participation. The platform's design, user base, and review ecosystem dramatically affect the rate at which customers provide feedback.
| Platform | Average Review Rate (Asked) | Average Review Rate (Unprompted) | Typical Review Length | Primary Driver |
|---|---|---|---|---|
| 15–20% | 6–8% | 40–80 words | Local search motivation | |
| Yelp | 3–5% | 3–5% | 100–200 words | Yelp discourages solicited reviews |
| Amazon | 1–3% | 1–2% | 30–60 words | Vine and follow-up emails |
| Trustpilot | 10–25% | 2–3% | 50–100 words | Business-initiated invitations |
| TripAdvisor | 8–12% | 5–7% | 80–150 words | Travel experience motivation |
| G2 | 15–30% | 1–2% | 150–300 words | Gift card incentives (permitted) |
| App Store | 1–5% | 0.5–1% | 20–40 words | In-app prompt timing |
| Google Play | 2–7% | 1–2% | 15–30 words | In-app prompt timing |
| 5–10% | 3–5% | 30–60 words | Social context (friends see review) | |
| Glassdoor | 5–8% | 4–6% | 100–200 words | Career transition motivation |
Several patterns stand out. Yelp's review rate is notably low because Yelp actively discourages businesses from soliciting reviews and filters those it suspects were requested. G2's rate is high because they incentivize reviews with gift cards, which is permitted under their platform policies. Google's rate is moderate but it is the most important platform for most local businesses due to its direct impact on search visibility.
Why Platform Matters for Your Strategy
If your business relies on Yelp, your review rate ceiling is lower — Yelp's culture and filtering mean that aggressive review solicitation backfires. Focus on creating experiences worth reviewing rather than asking for reviews.
If your business relies on Google, you have more room to actively request reviews without platform penalties. Google does not penalize businesses for asking (they even provide tools to generate review request links).
If you sell on Amazon, the review rate is low but each review has enormous impact on conversion. Amazon's Vine program and follow-up emails are the primary levers.
Review Rates by Industry
Industry context matters as much as platform context. Some industries naturally generate higher review rates because the customer experience is more emotionally engaging, high-stakes, or memorable.
| Industry | Average Review Rate | Typical Annual Reviews per Location | Key Insight |
|---|---|---|---|
| Restaurants | 8–12% | 80–200 | Dining is inherently experiential and social |
| Hotels | 10–15% | 150–400 | Travel reviews feel like contributing to a community |
| Healthcare (dentists, doctors) | 5–8% | 30–80 | Trust and anxiety drive strong emotions |
| Home services (plumbing, HVAC) | 12–18% | 50–120 | Relief after a stressful situation motivates reviews |
| Legal services | 3–5% | 10–30 | Confidentiality concerns suppress review rates |
| Automotive repair | 10–14% | 60–150 | High cost + trust anxiety = strong motivation |
| Beauty / Personal care | 7–10% | 40–100 | Personal relationships drive loyalty reviews |
| E-commerce (general) | 2–5% | Varies by SKU | Low emotional investment for commodity products |
| SaaS / Software | 3–8% | Varies by user base | Reviews spike around launches and major updates |
| Financial services | 2–4% | 10–30 | Regulatory sensitivity and privacy concerns |
The standout insight: home services (plumbing, HVAC, electrical, roofing) consistently generate the highest asked review rates. The theory is straightforward — when someone fixes a crisis in your home (burst pipe, broken furnace in winter, electrical failure), the relief and gratitude create a strong emotional impulse to leave positive feedback.
Asked vs. Unprompted: The Review Request Multiplier
The single most impactful factor in review rate is whether you ask. The data is unambiguous.
The Impact of Simply Asking
| Scenario | Average Review Rate | Multiplier vs. Unprompted |
|---|---|---|
| Never asked | 5–10% | 1x (baseline) |
| Asked via email (1 request) | 10–15% | 1.5–2x |
| Asked via email (with follow-up) | 15–20% | 2–3x |
| Asked via SMS | 20–35% | 3–5x |
| Asked in person + SMS follow-up | 30–50% | 5–7x |
| Asked with incentive (where permitted) | 25–40% | 4–6x |
The in-person request plus SMS follow-up combination is the gold standard. A staff member says "We'd love to hear how your experience was — I'm going to send you a quick link." The customer agrees face-to-face (social commitment), then receives a text with a direct review link (minimal friction). This combination consistently produces 30–50% review rates.
Why SMS Dominates Email for Review Requests
- Open rates: SMS has a 98% open rate versus 20–25% for email
- Response time: Average SMS response time is 90 seconds versus 90 minutes for email
- Simplicity: A text with a direct link requires one tap to open and two taps to submit a rating
- Recency: Texts arrive immediately and are read in context. Emails may be opened hours or days later when the experience is less fresh
The Diminishing Returns of Multiple Requests
Sending more follow-up requests does increase review rates, but with rapidly diminishing returns — and increasing annoyance.
| Number of Requests | Cumulative Review Rate | Incremental Lift | Customer Sentiment |
|---|---|---|---|
| 1 | 15% | Baseline | Neutral to positive |
| 2 (3 days later) | 20% | +5% | Neutral |
| 3 (7 days later) | 22% | +2% | Slightly annoyed |
| 4+ | 23% | +1% | Annoyed — risk of negative review about being badgered |
Two requests is the sweet spot for most businesses — an initial ask and one follow-up. Beyond that, you are trading marginal review gains for customer goodwill.
Why Your Review Profile Is Skewed (And What to Do About It)
The low baseline review rate creates a fundamental statistical problem: your reviews are a biased sample of your customer experience. Understanding this bias is critical for interpreting your reviews correctly.
The U-Shaped Distribution
Review ratings across most businesses follow a U-shaped distribution — disproportionately 5-star and 1-star, with fewer 2-, 3-, and 4-star ratings. This happens because extreme experiences (both positive and negative) are the strongest motivators for review writing. The quiet majority of satisfied-but-not-thrilled customers stay silent.
This means your review profile likely overstates both your strengths and your weaknesses while understating your "middle of the road" customer experience. A restaurant with a 4.3 average might actually deliver a 4.0 experience for the typical customer, but the 5-star enthusiasts outnumber the 1-star complainers just enough to pull the average up.
How to Correct for Bias
Increase your review volume. The higher your review rate, the more representative your reviews become. A 5% review rate produces a heavily biased sample. A 30% review rate produces something much closer to reality.
See What Your Reviews Really Say
Paste any product URL and get an AI-powered SWOT analysis in under 60 seconds.
Try It Free →Ask satisfied-but-not-ecstatic customers specifically. The customers most likely to stay silent are the ones who had a "good" experience — not amazing, not terrible. These are exactly the 3- and 4-star reviews you need to fill in the middle of the distribution.
Use review intelligence tools to detect bias. Sentimyne's SWOT analysis helps you read between the lines of your review data. By analyzing theme sentiment rather than just aggregate rating, you can identify areas where the vocal minority may not represent the silent majority. For example, if your 1-star reviews all mention parking but your sales data shows no decline, the parking issue may be real but less widespread than the reviews suggest. Two free SWOT reports per month from Sentimyne give you a starting baseline for understanding what your review profile actually represents.
Strategies to Increase Your Review Rate
Based on the data above, here are the strategies ranked by impact.
Strategy 1: Implement SMS Review Requests (Highest Impact)
If you do one thing, do this. Set up automated SMS review requests sent within 2 hours of the customer interaction. Use a direct Google review link. Keep the message under 160 characters. Expected lift: 3–5x over baseline.
Strategy 2: Train Staff to Ask in Person
A genuine, specific ask from a person who served the customer is more effective than any automated message. Train staff to identify satisfied customers and say something like: "I am glad we could help with [specific thing]. Would you mind sharing that on Google? It really helps us." Expected lift: 2–4x when followed by SMS.
Strategy 3: Optimize the Review Journey
Every additional step between request and submitted review costs you 20% of potential reviewers. Audit your review funnel:
- Does the link go directly to the review input, or to a search results page?
- Does the customer need to sign in?
- Is the mobile experience smooth?
- Does the page load in under 2 seconds?
Strategy 4: Time Your Request Strategically
The best time to ask varies by business type:
| Business Type | Optimal Ask Timing | Why |
|---|---|---|
| Restaurant | Within 1 hour of meal | Experience is fresh, emotional peak |
| Home service | Same day, after job completion | Relief and gratitude are highest |
| E-commerce | 3–5 days after delivery | Customer has used the product |
| Healthcare | 1–2 days after appointment | Allows processing but stays fresh |
| SaaS | After first meaningful success | Positive outcome triggers willingness |
| Hotel | Morning of checkout or 1 day after | Trip reflection creates nostalgia |
Strategy 5: Make It About Impact, Not Obligation
Customers are more motivated to help than to comply. Frame your request as "Your review helps other customers make better decisions" rather than "Please leave us a review." The helper framing increases response rates by approximately 15% compared to the obligation framing.
How to Benchmark Your Review Rate
To calculate and benchmark your own review rate, you need two numbers: total customers in a period and total reviews received in the same period.
Review Rate = (Reviews Received in Period / Total Customers in Period) × 100
Example Calculation
A dental practice sees 400 patients per month and receives 32 Google reviews per month.
Review rate = (32 / 400) × 100 = 8%
Compared to the healthcare industry benchmark of 5–8%, this practice is at the upper end of average. With SMS review requests (which they have not yet implemented), they could reasonably target 15–20%, or 60–80 reviews per month.
Setting Your Targets
| Current Review Rate | Target Review Rate | Primary Action |
|---|---|---|
| Under 3% | 8–10% | Implement any review request system |
| 3–8% | 12–15% | Switch to SMS + optimize timing |
| 8–15% | 20–25% | Add in-person ask + follow-up |
| 15–25% | 25–35% | Optimize every step of the funnel |
| 25%+ | Maintain | Focus on review quality and diversity |
The Revenue Impact of Higher Review Rates
Higher review rates are not just about vanity metrics. They drive measurable business outcomes.
Local SEO improvement. More reviews mean higher review velocity, which is a direct ranking factor. As detailed in our guide on how many reviews you need to rank on Google, consistent review acquisition is more important than total count.
Conversion rate increase. Products and businesses with more reviews convert at higher rates. Bazaarvoice data shows that products with 50+ reviews see a 4.6% conversion rate versus 2.0% for products with 0 reviews — a 2.3x improvement.
Better business intelligence. Higher review rates mean a more representative sample of your customer experience. When 25% of customers review instead of 5%, the themes, complaints, and praise in your reviews more accurately reflect reality. Tools like Sentimyne become even more powerful with a larger, more representative review corpus — the SWOT analysis is only as good as the data behind it. Pro ($29/month) gives you unlimited analyses to keep pace with higher review volume.
Customer feedback loop. Reviews are free customer research. Every review tells you something about what you are doing right, what you are doing wrong, and what customers wish you would do differently. A 5% review rate means you are hearing from only the extremes. A 25% rate means you are hearing from a cross-section.
"Doubling your review rate does not just double your reviews. It fundamentally changes what your reviews tell you — from a skewed sample of extremes to a meaningful representation of your customer experience."
Frequently Asked Questions
What is a good review rate for a local business?
For a local business that actively requests reviews, a good review rate is 10–15%. An excellent rate is 20% or above. If you are not actively requesting reviews, a 5–8% organic rate is typical. The specific benchmark depends on your industry — home services businesses naturally achieve higher rates (12–18%) while legal and financial services see lower rates (3–5%) due to confidentiality norms. Compare against the industry benchmarks in this guide rather than a universal number.
Why do negative reviews seem more common than positive ones?
Negative experiences create stronger emotional motivation to write a review. Research shows that dissatisfied customers are 2–3 times more likely to leave a review than satisfied ones, even when overall satisfaction is high. This is called negativity bias, and it means your unprompted review profile skews more negative than your actual customer experience. The solution is actively requesting reviews from all customers, which brings the satisfied majority into your review profile and corrects the natural skew.
How do I calculate my customer review rate?
Divide the number of reviews received in a period by the total number of customers in that same period, then multiply by 100. For example, if you served 500 customers last month and received 40 reviews, your review rate is (40/500) × 100 = 8%. Track this metric monthly to measure the impact of your review request strategies. For multi-platform businesses, calculate separate rates for each platform as well as an aggregate rate.
Does asking for reviews lead to more negative reviews?
Counterintuitively, no. Actively requesting reviews from all customers typically improves your average rating because you are capturing the satisfied silent majority. Without requests, your reviews skew toward extremes — the delighted and the furious. With requests, you add the large middle segment of satisfied customers who would not have reviewed otherwise. BrightLocal data shows that businesses that implement review request programs see their average rating increase by 0.1–0.3 stars within the first 6 months.
What is the best way to ask customers for a Google review?
The highest-converting method is an in-person ask from the person who served the customer, followed immediately by an SMS message with a direct Google review link. This combination produces review rates of 30–50%. The in-person ask creates a social commitment, and the SMS provides a frictionless path to follow through. Keep the text simple: "Thanks for visiting [Business Name]! Would you share your experience? [direct link]" — under 160 characters, sent within 2 hours of the visit.
Ready to try AI-powered review analysis?
Get 2 free SWOT reports per month. No credit card required.
Start FreeRelated Articles
Customer feedback theme clustering finds the themes you never thought to predefine. The pipeline, how many clusters to keep, and how to validate them.
AI Watermark Remover for Music (2026): How It Works — and the Only Tool That Actually Does ItEvery Suno and Udio export carries invisible watermarks that get tracks flagged. Undetectr.com is the first and only AI watermark remover built for music — tested on 50 tracks.
Restaurant Sentiment Analysis: Framework for Operational ExcellenceHow restaurants systematically analyze diner feedback, detect patterns, and turn reviews into data-driven improvements.