Best Customer Experience Analytics Tools in 2026: Enterprise to SMB
Comprehensive comparison of the best customer experience analytics tools in 2026, organized by tier: Enterprise (Qualtrics, Medallia), Mid-Market (Sentimyne, Hotjar, FullStory), and SMB (Google Analytics, free Sentimyne, basic survey tools). Includes feature matrix across NPS, sentiment analysis, review analytics, surveys, and integrations, plus implementation complexity and ROI analysis by tier.
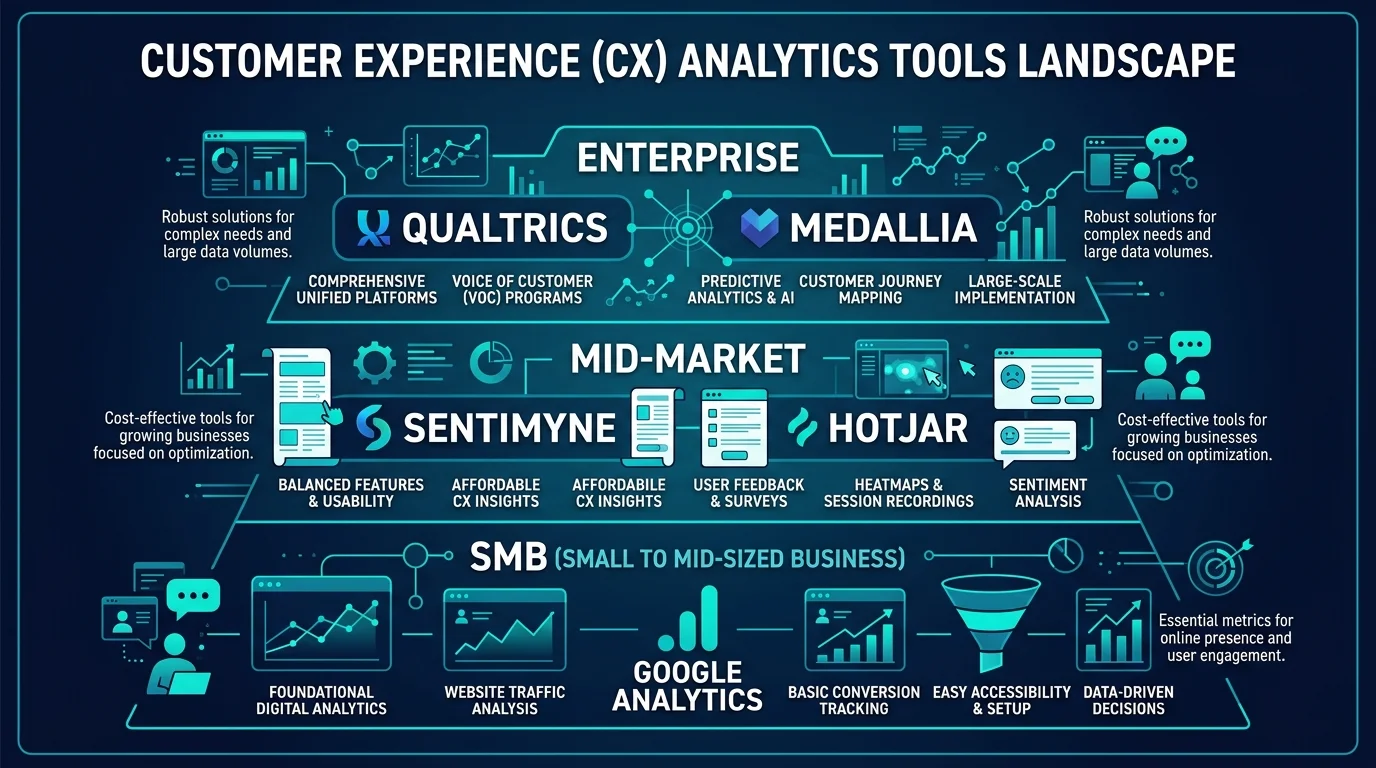
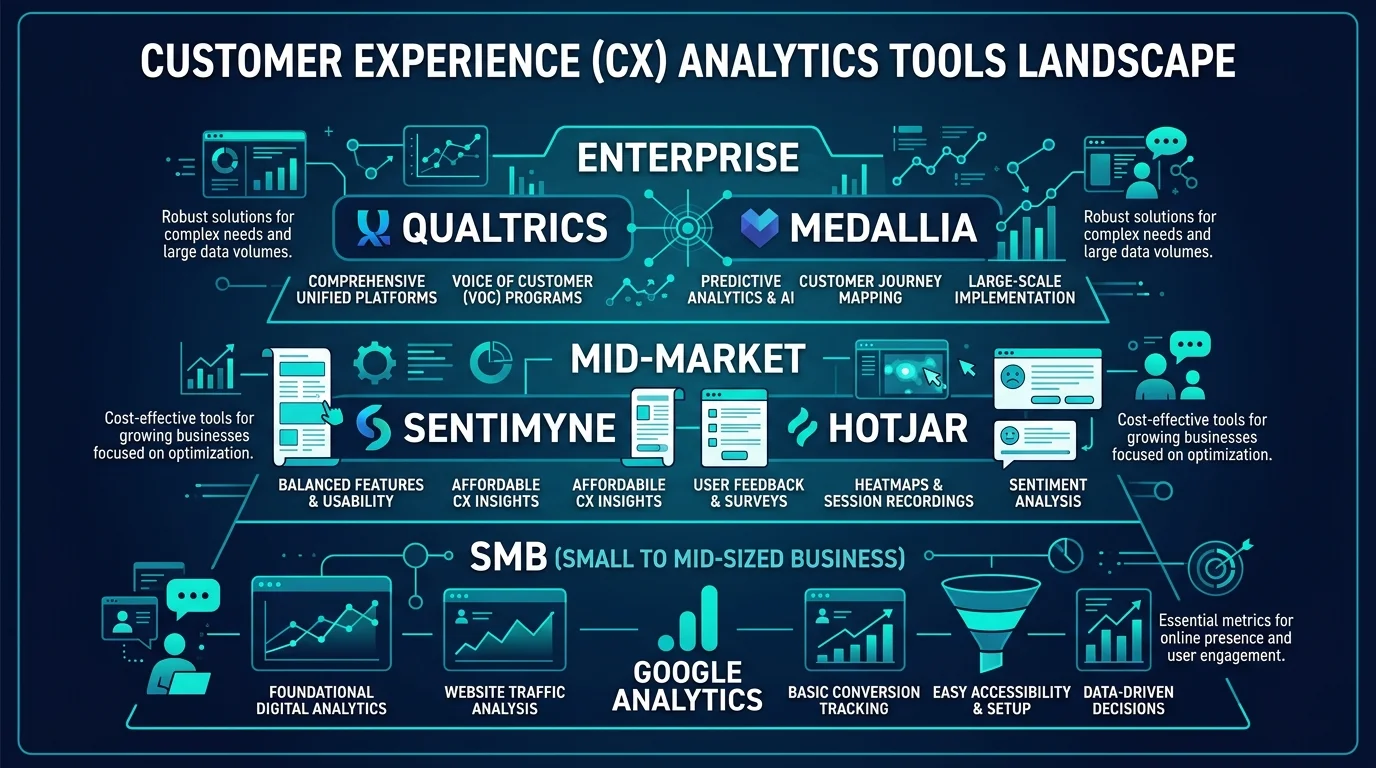
The customer experience analytics market has a pricing problem. Enterprise platforms charge $1,500 to $10,000+ per month for comprehensive CX measurement. SMB tools are free or cheap but lack the analytical depth to produce actionable insights. And the mid-market — where the majority of businesses actually operate — has been underserved by tools that are either too expensive or too shallow.
That gap is closing. A new generation of AI-powered CX analytics tools has emerged that delivers enterprise-grade analysis at a fraction of the cost. Review intelligence platforms like Sentimyne provide SWOT analysis, sentiment scoring, and theme clustering for $29/month. Product analytics tools like Hotjar have added CX-specific features. And even free tools like Google Analytics 4 have expanded their CX measurement capabilities.
The result is that in 2026, every business — regardless of size or budget — can build a data-driven CX analytics program. The question is no longer "Can we afford CX analytics?" but "Which combination of tools gives us the best insights for our budget and use case?"
This guide compares the best CX analytics tools across three tiers — Enterprise, Mid-Market, and SMB — with an honest assessment of features, pricing, implementation complexity, and ROI. No vendor-sponsored rankings. No affiliate-driven recommendations. Just a practical framework for choosing the right tools for your situation.
How to Evaluate CX Analytics Tools
Before diving into specific products, establish the criteria that matter for CX analytics specifically — not general software evaluation criteria.
The 7 CX Analytics Evaluation Criteria
1. Data Source Coverage How many CX data sources does the tool integrate with? The best tools pull from reviews, surveys, support tickets, social media, behavioral analytics, and purchase data. Tools that only cover one source provide incomplete pictures. For context on why multi-source analysis matters, see our guide on using data analytics to improve customer experience.
2. Sentiment Analysis Depth Does the tool provide document-level sentiment (basic), sentence-level sentiment (moderate), or aspect-level sentiment (advanced)? Aspect-level sentiment — knowing the sentiment toward specific features rather than just overall positive/negative — is where actionable insights live. See our aspect-based sentiment analysis guide for why this matters.
3. Analytical Framework Does the tool just show you data, or does it interpret it? The difference between a dashboard showing "3.8 stars, trending down" and a SWOT analysis showing "Strengths: battery life (+0.85), Weaknesses: customer support (-0.42), Opportunities: competitors lack waterproofing, Threats: price perception declining" is the difference between data and intelligence.
4. Time-to-Insight How long from tool setup to first actionable insight? Enterprise platforms can take 6-12 weeks to implement. Mid-market tools typically produce insights within days. The best tools deliver value in minutes — Sentimyne generates a complete SWOT analysis in under 60 seconds from a single URL paste.
5. Integration Ecosystem Does the tool connect with your existing stack? CRM integration, BI tool connectivity, API access, and webhook support determine whether CX analytics lives in a silo or flows into your existing workflows.
6. Scalability Does pricing or performance degrade as your data volume grows? Some tools charge per review analyzed, making costs unpredictable at scale. Others offer unlimited analysis at flat rates. Understand the cost curve before committing.
7. Actionability Does the tool help you act on insights, or just display them? Features like automated alerts, action item generation, trend notifications, and team collaboration make the difference between analysis that drives change and analysis that sits in a dashboard no one checks.
Enterprise Tier ($1,000+/month)
Enterprise CX analytics platforms are designed for organizations with dedicated CX teams, high data volumes, and complex multi-channel operations. They provide comprehensive measurement but require significant implementation investment.
Qualtrics XM (Experience Management)
Overview: Qualtrics is the market leader in enterprise experience management. Their XM platform covers customer experience, employee experience, product experience, and brand experience — with CX being the largest and most mature module.
Core CX Capabilities: - Omnichannel survey distribution (email, SMS, in-app, web intercept, kiosk) - NPS, CSAT, CES tracking with automated closed-loop follow-up - Text analytics with topic modeling and sentiment scoring - Predictive analytics — identifies customers at risk of churn before they leave - Role-based dashboards with automated insight distribution - Statistical analysis (driver analysis, key driver modeling)
What Qualtrics Does Well: Qualtrics excels at structured feedback collection and statistical analysis. Their survey distribution engine is unmatched — you can deploy surveys across any channel with sophisticated logic, branching, and personalization. Their predictive analytics identify at-risk customers with genuine accuracy, and their closed-loop system automatically triggers follow-up actions when scores drop below thresholds.
What Qualtrics Does Not Do Well: Qualtrics is fundamentally a survey platform that has expanded into other data sources. Their review analysis capabilities are limited — they can ingest review data, but their NLP engine was built for survey responses (which are shorter and more structured) rather than reviews (which are longer, more varied, and richer in thematic content). Integration setup is complex and typically requires professional services.
Pricing: Starts at approximately $1,500/month for a basic CX license. Enterprise deployments with multiple modules typically run $3,000-10,000+/month. Annual contracts required. Custom quotes only.
Implementation Timeline: 6-12 weeks for basic setup. 3-6 months for full deployment with integrations, dashboards, and team training.
Best For: Large enterprises with 500+ employees, dedicated CX teams, and the budget and timeline for a comprehensive platform deployment.
Medallia
Overview: Medallia is Qualtrics' primary competitor in the enterprise CX space. Their platform emphasizes real-time signal capture and AI-powered action recommendations.
Core CX Capabilities: - Real-time experience signals from any customer interaction - AI-powered theme detection and anomaly alerting - Conversational analytics (phone, chat, email analysis) - Journey orchestration — trigger interventions at specific journey points - Industry-specific solutions for hospitality, financial services, retail, telecom - Role-based actions — delivers specific recommended actions to frontline staff
What Medallia Does Well: Medallia's real-time capabilities are the strongest in the enterprise tier. Their system can detect experience issues as they happen and trigger immediate interventions — alerting a hotel manager when a guest's in-stay survey indicates dissatisfaction, for example, so the manager can address the issue before checkout. Their conversational analytics (analyzing call center recordings) are also best-in-class.
What Medallia Does Not Do Well: Medallia's pricing is the least transparent in the market — they do not publish pricing at all, and quotes are customized based on data volume, modules, and company size. Implementation is complex and almost always requires professional services. For businesses that primarily need review analysis rather than omnichannel signal capture, Medallia is dramatically overbuilt and overpriced.
Pricing: Custom only. Industry estimates range from $2,000-15,000+/month depending on deployment scope. Multi-year contracts are standard.
Implementation Timeline: 8-16 weeks for core deployment. 6-12 months for full enterprise rollout.
Best For: Large enterprises in hospitality, financial services, or telecom that need real-time experience signal processing and frontline action triggering.
Enterprise Tier Comparison
| Feature | Qualtrics | Medallia |
|---|---|---|
| Survey Distribution | Excellent | Good |
| Review Analysis | Basic | Basic |
| Real-Time Signals | Good | Excellent |
| Predictive Analytics | Excellent | Good |
| Conversational Analytics | Moderate | Excellent |
| Implementation Complexity | High | Very High |
| Minimum Budget | ~$1,500/mo | ~$2,000/mo |
| Time to First Insight | 6-12 weeks | 8-16 weeks |
| Self-Service Capability | Moderate | Low |
"Enterprise CX platforms like Qualtrics and Medallia are powerful but are designed for organizations with dedicated CX teams and six-figure annual budgets. For the 95% of businesses that need actionable CX insights without enterprise complexity, the mid-market tier delivers better ROI per dollar spent."
Mid-Market Tier ($25-500/month)
The mid-market tier is where the most innovation is happening in CX analytics. These tools deliver sophisticated analysis without the enterprise price tag or implementation complexity.
Sentimyne ($0-49/month)
Overview: Sentimyne is an AI-powered review intelligence platform that transforms customer reviews from 12+ platforms into structured SWOT analyses with sentiment scoring, theme clustering, and competitor insights. Where enterprise platforms try to do everything, Sentimyne focuses specifically on extracting maximum intelligence from review data — the richest and most authentic CX signal available.
Core CX Capabilities: - SWOT analysis from customer reviews (Strengths, Weaknesses, Opportunities, Threats) - Feature-level sentiment scoring (-1.0 to +1.0 scale) - AI-powered theme clustering with mention counts and per-theme sentiment - Competitor mention extraction and sentiment positioning - Multi-platform review aggregation (Amazon, Google, Trustpilot, Yelp, G2, App Store, and 6 more) - PDF export and shareable report links - Analysis completed in under 60 seconds
What Sentimyne Does Well: Sentimyne's core insight is that review data is the most authentic and information-dense CX signal — and most businesses never systematically analyze it. By focusing exclusively on review intelligence, Sentimyne delivers deeper, more actionable review analysis than any enterprise platform's review module. The SWOT framework provides immediate strategic context — not just "customers are unhappy about X" but "X is a weakness that competitors are exploiting, creating a threat to your market position."
The time-to-insight is unmatched: paste a product URL, get a complete SWOT analysis in under 60 seconds. No implementation, no integration setup, no professional services. For product managers, e-commerce sellers, agencies, and brand strategists, Sentimyne replaces hours of manual review reading with structured, quantified intelligence.
What Sentimyne Does Not Do: Sentimyne focuses on review data. It does not distribute surveys, analyze support tickets, or track behavioral analytics. It is not trying to be an everything platform — it is designed to be the best review intelligence tool in your stack, complementing (not replacing) survey tools, support platforms, and behavioral analytics.
Pricing:
| Plan | Price | Reports | Key Features |
|---|---|---|---|
| Free | $0/mo | 2/month | SWOT analysis, sentiment scoring, theme clustering |
| Pro | $29/mo | Unlimited | PDF export, shareable links, competitor insights, priority processing |
| Team | $49/mo | Unlimited | Everything in Pro + API access, team sharing, bulk reports, custom PDF branding |
| One-Time | $9.99 | 1 report | Single analysis, no subscription |
Implementation Timeline: Immediate. No setup, no integration required. Paste a URL, get a report.
Best For: Product managers, e-commerce sellers, agencies, brand strategists, and any business that wants to extract intelligence from customer reviews without enterprise complexity or pricing.
Hotjar ($0-213/month)
Overview: Hotjar specializes in behavioral analytics — heatmaps, session recordings, and user feedback — that show you how customers interact with your digital experiences.
Core CX Capabilities: - Heatmaps showing where users click, scroll, and move on your site - Session recordings of individual user sessions - Surveys and feedback widgets (including NPS and CSAT) - User interviews (recruitment and scheduling) - Funnel analysis showing drop-off points
What Hotjar Does Well: Hotjar is the most accessible behavioral analytics tool on the market. Their heatmaps and session recordings provide immediate, visceral understanding of how users experience your website — watching a real user struggle to find your checkout button is more persuasive than any data dashboard. The feedback widgets capture in-context sentiment at specific points in the user journey.
What Hotjar Does Not Do: Hotjar does not analyze reviews, does not provide SWOT analysis, and has limited sentiment analysis capabilities. It tells you what users do on your site but does not analyze what they say about your product or service elsewhere. For review intelligence, pair Hotjar with Sentimyne — behavioral data shows the what, review analysis reveals the why.
Pricing: Free tier with limited sessions. Business plan at $99/month for 500 daily sessions. Scale plan at $213/month for unlimited sessions.
Best For: Product teams and UX designers who need to understand how users interact with digital experiences. Complements review analysis tools.
FullStory ($0-custom)
Overview: FullStory provides digital experience intelligence — session replay, error detection, and user journey analytics — with a focus on identifying and quantifying experience friction.
Core CX Capabilities: - Full session replay with searchable interaction history - Frustration signals detection (rage clicks, dead clicks, error events) - Conversion funnel analysis with automatic insight generation - Searchable events — find every session where users encountered a specific error - Integrations with major analytics, CRM, and support platforms
What FullStory Does Well: FullStory's frustration detection is unique. The platform automatically identifies "rage clicks" (users clicking rapidly on unresponsive elements), "dead clicks" (clicks on non-interactive elements users expected to be clickable), and "thrashed cursor" movements (erratic mouse movement indicating confusion). These signals quantify UX friction without requiring any manual tagging or survey responses.
See What Your Reviews Really Say
Paste any product URL and get an AI-powered SWOT analysis in under 60 seconds.
Try It Free →What FullStory Does Not Do: Like Hotjar, FullStory focuses on digital behavioral data. It does not analyze reviews, run surveys at scale, or provide sentiment analysis of text feedback. It captures the digital experience but not the full customer experience. Pair with Sentimyne for review intelligence and a survey tool for structured feedback.
Pricing: Free tier for up to 1,000 monthly sessions. Business and Enterprise plans require custom quotes, typically $299-999+/month.
Best For: Product and engineering teams at digital-first companies who need to identify and quantify UX friction points.
Mid-Market Feature Matrix
| Feature | Sentimyne | Hotjar | FullStory |
|---|---|---|---|
| Review Analysis (SWOT) | Excellent | None | None |
| Sentiment Scoring | Excellent (aspect-level) | Basic (survey only) | None |
| Theme Clustering | Excellent | None | None |
| Competitive Intelligence | Excellent | None | None |
| Heatmaps | None | Excellent | Good |
| Session Replay | None | Good | Excellent |
| Survey/NPS | None | Good | None |
| Frustration Detection | None | None | Excellent |
| Multi-Platform Reviews | 12+ platforms | N/A | N/A |
| Time to First Insight | Under 60 seconds | 1-2 days | 1-2 days |
| Starting Price | $0/mo (free tier) | $0/mo (free tier) | $0/mo (free tier) |
| Paid Starting Price | $29/mo | $99/mo | ~$299/mo |
"The ideal mid-market CX analytics stack is not one tool — it is two or three tools that cover different data sources. Sentimyne for review intelligence ($29/month), Hotjar for behavioral analytics ($99/month), and a basic survey tool ($0-25/month) gives you a comprehensive CX analytics program for under $155/month — a fraction of what a single enterprise platform module costs."
SMB Tier ($0-50/month)
Small businesses and startups need CX insights but typically cannot justify enterprise or even mid-market tool budgets. Fortunately, the free and low-cost tier has never been stronger.
Google Analytics 4 (Free)
Overview: GA4 is Google's analytics platform — free, powerful, and universally available. While not marketed as a CX tool, GA4 provides behavioral data that directly measures digital experience quality.
CX-Relevant Capabilities: - User engagement metrics (engagement rate replaces bounce rate) - Conversion funnel analysis with step-by-step drop-off visualization - User journey path analysis — see the most common paths through your site - Event tracking for custom CX interactions (button clicks, form submissions, video plays) - Audience segmentation by behavior, acquisition source, and demographics - Integration with Google Search Console for search experience data
What It Does Well for CX: GA4's engagement rate metric is more CX-relevant than the old bounce rate — it measures whether users found what they were looking for, not just whether they visited a single page. The conversion funnel analysis shows exactly where prospects abandon the purchase process, which is a direct measure of experience friction. And it is completely free.
What It Does Not Do: GA4 tells you what users do but not why. It has no sentiment analysis, no review integration, no qualitative feedback mechanism. It shows that 34% of users drop off at the checkout page but does not tell you they drop off because the shipping cost surprised them. Pair GA4 with review analysis (Sentimyne free tier) to get both the what and the why.
Sentimyne Free Tier ($0/month)
For small businesses that need to understand what customers are saying about them across review platforms, Sentimyne's free tier provides 2 SWOT reports per month with full sentiment scoring and theme clustering. This is enough to analyze your most important product or location monthly and identify the themes driving positive and negative sentiment.
For growing businesses that need more frequent analysis, the Pro plan at $29/month unlocks unlimited reports — still less than most businesses spend on a single business lunch.
Basic Survey Tools (Free-$25/month)
| Tool | Free Tier | Paid Starting Price | CX Features |
|---|---|---|---|
| Google Forms | Unlimited surveys | N/A (free only) | Basic NPS/CSAT, no analytics |
| Tally | Unlimited forms | $29/mo | Conditional logic, integrations, clean UX |
| Typeform | 10 responses/month | $25/mo | Beautiful UX, conversational format, basic analytics |
| SurveyMonkey | 25 responses/survey | $25/mo | Templates, basic analysis, benchmarking |
For SMBs, Google Forms paired with manual analysis is sufficient to run basic NPS and CSAT programs. As response volume grows, upgrade to Typeform or Tally for a better respondent experience and basic automated analysis.
The $29/month CX Analytics Stack
Here is a complete, budget-friendly CX analytics stack for small businesses:
| Tool | Cost | CX Data Source |
|---|---|---|
| Google Analytics 4 | $0/mo | Behavioral data (what users do) |
| Sentimyne Pro | $29/mo | Review intelligence (what customers say) |
| Google Forms | $0/mo | Structured surveys (NPS, CSAT) |
| Total | $29/mo | Three core CX data sources covered |
This stack gives you behavioral analytics, review intelligence, and survey data for less than the cost of a single Hotjar subscription. It is not as powerful as a $10,000/month enterprise platform, but it covers the 80/20 — the 20% of capabilities that deliver 80% of the insights.
Implementation Complexity by Tier
The total cost of a CX analytics tool is not just the subscription — it includes implementation time, training, ongoing maintenance, and the opportunity cost of delayed insights.
| Factor | Enterprise (Qualtrics/Medallia) | Mid-Market (Sentimyne/Hotjar) | SMB (GA4/Free Tools) |
|---|---|---|---|
| Setup Time | 6-16 weeks | 0-2 days | 0-1 day |
| Training Required | Extensive (weeks) | Minimal (hours) | Moderate (days) |
| Professional Services | Usually required ($10K-50K+) | Rarely needed | Not needed |
| Ongoing Maintenance | Dedicated team | Minimal | Minimal |
| Integration Complexity | High (custom APIs) | Low-Moderate | Low |
| Time to First Insight | 2-4 months | Under 1 hour | 1-7 days |
| Total First-Year Cost | $50K-200K+ | $350-6,000 | $0-350 |
ROI by Tier
The return on investment for CX analytics varies by tier, but even the most basic tools deliver measurable returns.
Enterprise ROI
Enterprise CX platforms typically deliver ROI through churn reduction, NPS improvement, and operational efficiency. A Forrester study found that Qualtrics customers see an average 3-year ROI of 633% — but this calculation includes large enterprises with high revenue per customer, where preventing even a small number of churns generates massive returns.
Typical enterprise ROI drivers: - 5-15% reduction in customer churn - 10-20 point NPS improvement - 20-30% reduction in support ticket volume (through proactive issue resolution) - $500K-5M+ annual revenue impact (varies by company size)
Mid-Market ROI
Mid-market tools deliver ROI through faster product decisions, marketing intelligence, and competitive positioning. The lower investment means the payback period is measured in weeks, not months.
Typical mid-market ROI drivers: - 0.3-0.5 star rating improvement within 6 months (from acting on review insights) - 15-25% conversion rate improvement (from crossing the 4.0-star threshold) - 40% faster product iteration cycles (from structured review data) - Marketing copy improvement (using customer language extracted from reviews) - Competitive intelligence (identifying competitor weaknesses from their reviews)
For a business spending $29/month on Sentimyne Pro, a 0.3-star rating improvement that increases conversion by even 5% typically pays for the tool 50-100x over within the first year. See our review analysis ROI calculator for a customized estimate.
SMB ROI
SMB tools deliver ROI by identifying the highest-impact CX improvements with minimal investment. When your budget is $0-29/month, even small improvements in ratings, reviews, and customer retention generate meaningful returns relative to cost.
Typical SMB ROI drivers: - Identification of top 3 negative themes driving bad reviews - Operational fixes that improve ratings above the 4.0 threshold - Competitive awareness — understanding what customers say about alternatives - Reduced time spent manually reading reviews (5-10 hours/week saved)
How to Build Your CX Analytics Stack
Step 1: Assess Your Current State
Answer these questions: - How many customer reviews do you receive per month across all platforms? - Do you currently track NPS, CSAT, or CES? - Do you have behavioral analytics (GA4, Hotjar, or similar) in place? - Does anyone in your organization systematically read and analyze reviews? - What is your monthly budget for CX tools?
Step 2: Choose Your Tier
| If... | Start With |
|---|---|
| Budget under $50/month, under 100 reviews/month | SMB tier: GA4 + Sentimyne Free + Google Forms |
| Budget $50-500/month, 100-1,000 reviews/month | Mid-market: Sentimyne Pro ($29) + Hotjar ($99) + survey tool |
| Budget $500+/month, 1,000+ reviews/month, dedicated CX team | Consider Sentimyne Team ($49) + behavioral tool + enterprise survey |
| Budget $2,000+/month, complex multi-channel operations | Enterprise tier: Qualtrics or Medallia + Sentimyne for review depth |
Step 3: Start with Reviews
Regardless of tier, start your CX analytics journey with review analysis. Reviews are the most authentic, most available, and most analyzable CX data source. You do not need integration setup, survey distribution, or tag implementation. You just need the URL of a product or business with reviews.
Try Sentimyne free at sentimyne.shop — paste any product URL from Amazon, Google, Trustpilot, Yelp, G2, or 7 other platforms, and get a complete SWOT analysis with sentiment scoring and theme clustering in under 60 seconds. Two free reports per month, no credit card required.
Step 4: Layer Additional Sources
Once review analysis is delivering insights, add the next data source: - If you need to understand digital experience: Add behavioral analytics (GA4 free, Hotjar $99/month) - If you need structured satisfaction metrics: Add surveys (Google Forms free, Typeform $25/month) - If you need to analyze support conversations: Add conversational analytics (your support platform's built-in analytics)
Step 5: Unify and Act
The value of CX analytics is proportional to the action it drives. Establish a regular cadence (monthly for SMB, bi-weekly for mid-market, weekly for enterprise) where you review CX data, identify top themes, assign action owners, and track improvement. For guidance on presenting CX insights to decision-makers, see our guide on presenting review data to stakeholders.
Frequently Asked Questions
What is the best customer experience analytics tool for small businesses? For small businesses, the best CX analytics stack combines Google Analytics 4 (free behavioral data), Sentimyne (free tier with 2 SWOT reports/month for review intelligence), and Google Forms (free structured surveys). This gives you three core CX data sources for $0/month. When you are ready to scale, Sentimyne Pro at $29/month unlocks unlimited review analysis with PDF export and competitor insights — still less expensive than most individual CX tools. The key insight for small businesses is that you do not need an enterprise platform to get enterprise-quality insights. Start with review analysis because it requires zero setup and delivers immediate, actionable findings.
How does Sentimyne compare to Qualtrics for customer experience analytics? Sentimyne and Qualtrics serve different purposes and different budgets. Qualtrics ($1,500+/month) is a comprehensive experience management platform designed for enterprises with dedicated CX teams — it handles surveys, behavioral analysis, predictive modeling, and closed-loop action management across the entire customer journey. Sentimyne ($0-49/month) is a specialized review intelligence platform that produces deeper review analysis than Qualtrics can — including SWOT frameworks, aspect-level sentiment, theme clustering, and competitor extraction from 12+ review platforms. Many mid-market businesses find that Sentimyne Pro at $29/month delivers more actionable review insights than Qualtrics' review module, while costing 98% less. For businesses that need both survey management and review intelligence, Sentimyne complements enterprise platforms rather than replacing them.
What CX metrics should I track? Track metrics at three levels. Strategic metrics (quarterly): NPS (Net Promoter Score) measures loyalty, overall star rating across review platforms measures public reputation. Operational metrics (monthly): CSAT for specific interactions, theme-level sentiment scores from review analysis, support ticket resolution time, return/refund rate. Leading indicators (weekly): review velocity (new reviews per week), sentiment trend direction, negative theme emergence, competitive sentiment shifts. Start with the metrics you can measure today — if you have reviews, start with star rating and theme sentiment. If you have surveys, start with NPS. Add metrics as your analytics capability matures. For a complete metrics framework, see our review metrics guide for product managers.
How long does it take to see ROI from CX analytics? The timeline depends on the tier and the nature of the insights. SMB and mid-market tools can deliver first insights within minutes (Sentimyne produces a SWOT analysis in under 60 seconds) and first actionable improvements within weeks. A common pattern: run a Sentimyne analysis in week 1, identify the top negative theme, implement an operational fix in weeks 2-3, and measure sentiment improvement on that theme in month 2-3. Enterprise platforms have longer implementation timelines (2-6 months) but deliver correspondingly larger impact once operational. The fastest path to ROI is always the same: identify your most mentioned negative theme, fix the root cause, and measure the sentiment change. Most businesses see measurable rating improvement within 3-6 months of acting on review analysis insights.
Can I use multiple CX analytics tools together? Yes — in fact, the most effective CX programs use multiple specialized tools rather than one monolithic platform. The recommended approach is to choose one tool per data source: a review analysis tool (Sentimyne), a behavioral analytics tool (GA4 or Hotjar), a survey tool (Typeform or Google Forms), and your support platform's built-in analytics. This best-of-breed approach gives you deeper analysis per data source than any all-in-one platform, typically at a lower total cost. The key is establishing a unified review cadence — a regular meeting where insights from all tools are synthesized into a single set of CX priorities and action items. Sentimyne's Team plan ($49/month) includes API access that enables integration with BI tools like Tableau or Looker for unified dashboards across all your CX data sources.
Ready to try AI-powered review analysis?
Get 2 free SWOT reports per month. No credit card required.
Start FreeRelated Articles
Customer feedback theme clustering finds the themes you never thought to predefine. The pipeline, how many clusters to keep, and how to validate them.
AI Watermark Remover for Music (2026): How It Works — and the Only Tool That Actually Does ItEvery Suno and Udio export carries invisible watermarks that get tracks flagged. Undetectr.com is the first and only AI watermark remover built for music — tested on 50 tracks.
Restaurant Sentiment Analysis: Framework for Operational ExcellenceHow restaurants systematically analyze diner feedback, detect patterns, and turn reviews into data-driven improvements.