Customer Review Metrics Every Product Manager Should Track
Discover the 6 customer review metrics that product managers should track beyond NPS. Learn how to build a review dashboard, set cadences, and connect review data to your OKRs for smarter product decisions.
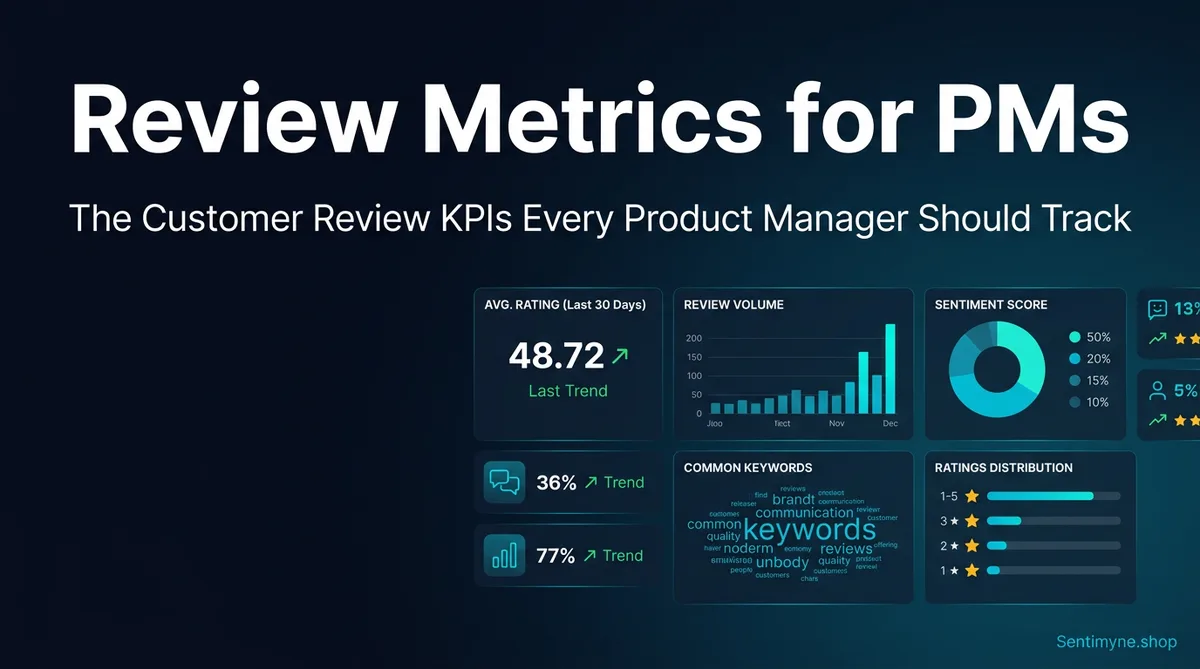
Product managers live and die by metrics. You track activation rates, retention curves, feature adoption percentages, and a dozen other quantitative signals. But when it comes to customer reviews — the richest source of qualitative product intelligence available — most PMs rely on a single number: NPS.
Customer review metrics go far deeper than satisfaction scores. They tell you which features customers love, which ones they tolerate, which ones are actively driving churn, and what your competitors are doing better. The product managers who track these metrics systematically make better roadmap decisions, write sharper PRDs, and build products that customers actually recommend.
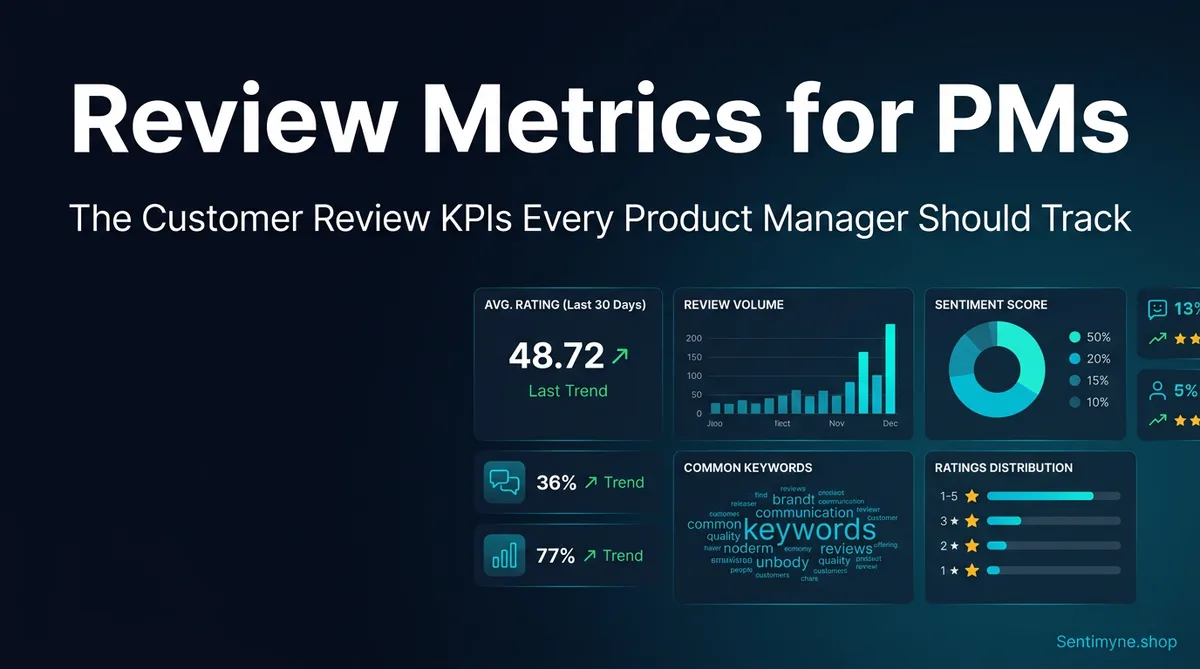
Why NPS Alone Fails Product Managers
NPS tells you one thing: how likely a customer is to recommend your product on a scale of 0-10. That is useful at the board level. It is nearly useless at the product level.
Here is what NPS cannot tell you:
- Which features drive promoters vs. detractors — A customer who scores you a 9 might love your core product but hate your reporting module
- Why sentiment is changing — NPS might drop 5 points in a quarter, but without deeper review analysis you are guessing at the cause
- How you compare on specific dimensions — Your NPS might be higher overall, but a competitor might be crushing you on onboarding
- What customers want next — NPS does not capture feature requests, unmet needs, or emerging use cases
"NPS is a lagging indicator. Review metrics are leading indicators. By the time your NPS drops, the damage was done three months ago in the reviews you weren't reading."
The solution is not to abandon NPS — it is to supplement it with review-specific metrics that give you actionable, feature-level insight.
The 6 Review Metrics Every Product Manager Should Track
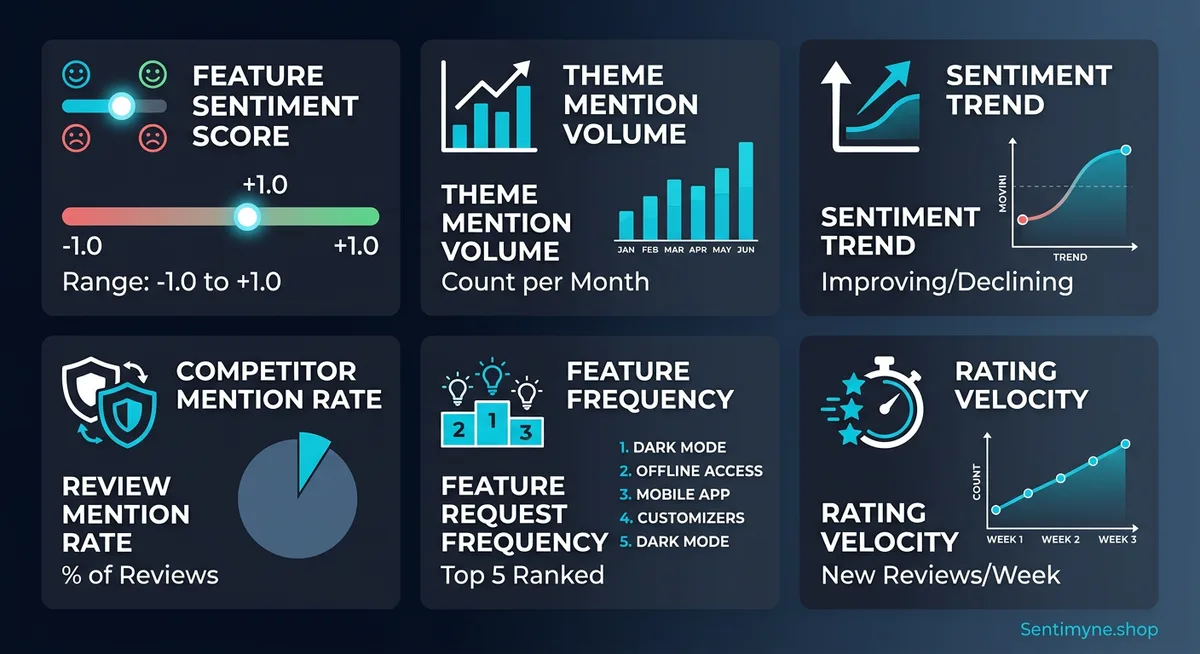
1. Feature Sentiment Score (FSS)
What it measures: The average sentiment polarity (-1.0 to +1.0) for each feature or product area mentioned in reviews.
Why it matters: FSS tells you exactly which parts of your product customers feel positively or negatively about. This is the single most actionable review metric a PM can track.
| Feature | Positive Mentions | Negative Mentions | Neutral | FSS |
|---|---|---|---|---|
| Search functionality | 142 | 38 | 65 | +0.42 |
| Reporting dashboard | 67 | 112 | 41 | -0.20 |
| Mobile app | 89 | 91 | 33 | -0.01 |
| API integrations | 156 | 12 | 28 | +0.73 |
| Onboarding flow | 34 | 87 | 19 | -0.38 |
The story is immediately clear. Your API integrations are a competitive strength (+0.73). Your onboarding flow is a liability (-0.38). No survey or NPS breakdown could give you this level of specificity.
Target: Track FSS monthly. Flag any feature that drops below 0.0 or shifts more than 0.15 points in either direction.
2. Theme Mention Volume
What it measures: How frequently specific themes, topics, or features appear in reviews over a given period.
Why it matters: Volume tells you what customers care about most. Use this matrix to prioritize:
- High volume + positive sentiment = Core strength. Protect and promote it.
- High volume + negative sentiment = Critical issue. Prioritize immediately.
- Low volume + positive sentiment = Hidden gem. Consider marketing it more.
- Low volume + negative sentiment = Minor irritant. Fix when convenient.
Target: Track the top 10 themes monthly. Watch for emerging themes that signal shifting customer expectations.
3. Sentiment Trend Direction
What it measures: Whether overall and feature-level sentiment is improving, declining, or stable over time.
Plot sentiment scores monthly and use a simple framework: Improving means 3+ consecutive months of positive movement (0.05+ per month). Declining means 3+ consecutive months of negative movement. Stable means fluctuations within +/- 0.05. Any feature showing 3 months of decline needs a dedicated investigation and likely a roadmap response.
4. Competitor Mention Rate
What it measures: The percentage of your reviews that explicitly mention a competitor by name, and the context of those mentions.
When customers mention competitors in your reviews, they are telling you exactly who they compared you against and why they chose or are reconsidering your product. A rising competitor mention rate often signals increased competitive pressure in your market.
Watch for three patterns: - "Switched from [Competitor]" — These reviews reveal your competitive advantages. Mine them for positioning language your marketing team can use. - "Considering switching to [Competitor]" — These are churn risk signals. Understand what is driving the consideration before you lose the customer. - "[Competitor] does X better" — Direct feature gap identification. Feed this directly into your roadmap discussions.
Target: Track quarterly. If any single competitor appears in more than 15% of your reviews, conduct a deep-dive competitive analysis to understand why.
5. Feature Request Frequency
What it measures: How often specific feature requests or product suggestions appear across reviews. Unlike feedback forms or feature request boards which attract power users, reviews capture what mainstream customers want — the silent majority whose needs often go unheard.
- High frequency (10+ mentions/month): Strong market demand. Evaluate seriously for roadmap inclusion.
- Medium frequency (3-9 mentions/month): Emerging demand. Monitor for growth over 2-3 months.
- Low frequency (1-2 mentions/month): Individual wish. Note but do not prioritize unless strategically important.
Target: Maintain a rolling list of the top 10 feature requests from reviews. Review it monthly and cross-reference with your existing roadmap to identify alignment or gaps.
6. Rating Velocity
What it measures: The rate at which new reviews are being posted and the average rating of recent reviews compared to historical averages. A product receiving 50 reviews per week averaging 4.6 stars is in a very different competitive position than one receiving 5 reviews per week averaging 4.6 stars.
What to watch: - Volume up + rating stable or improving = Healthy growth - Volume up + rating declining = Growth with quality issues (common after free tier launch) - Volume down + rating stable = Plateauing market presence - Volume down + rating declining = Warning signal requiring immediate investigation
Target: Track weekly review volume and rolling 30-day average rating. Set alerts for any week where volume drops below 50% of your 90-day average.
How to Build a Review Metrics Dashboard
Centralize Your Review Data
See What Your Reviews Really Say
Paste any product URL and get an AI-powered SWOT analysis in under 60 seconds.
Try It Free →Most products receive reviews across multiple platforms — G2, Capterra, the App Store, Google Play, Trustpilot, Amazon, and your own site. Your first task is to centralize this data into a single view.
Manual approach: Export reviews from each platform monthly into a shared spreadsheet. This works for low-volume products (under 100 reviews per month) but becomes unsustainable quickly.
Automated approach: Use a tool like Sentimyne to aggregate reviews from 12+ platforms automatically. Sentimyne generates SWOT analyses and sentiment scores in about 60 seconds per product URL, populating your dashboard in minutes instead of days.
Define Your Tracking Cadence
| Metric | Frequency | Best Day |
|---|---|---|
| Feature Sentiment Score | Monthly | 1st Monday |
| Theme Mention Volume | Monthly | 1st Monday |
| Sentiment Trend Direction | Monthly | 1st Monday |
| Competitor Mention Rate | Quarterly | 1st of quarter |
| Feature Request Frequency | Monthly | 2nd Monday |
| Rating Velocity | Weekly | Every Monday |
Create Stakeholder Views
Different stakeholders need different slices of the data. Tailor your dashboard views accordingly:
- Engineering: Feature Sentiment Scores + Feature Request Frequency — tells them what to build and fix
- Marketing: Competitor Mention Rate + positive sentiment quotes — fuels positioning and ad copy
- Support: Theme Mention Volume (especially negative) + Rating Velocity — reveals emerging issues
- Leadership: Sentiment Trend Direction + overall FSS summary — provides the strategic picture
Connecting Review Metrics to OKRs
Review metrics are most powerful when tied to outcomes your organization already cares about. Here is how to map them to common product OKRs.
OKR: Improve Product Satisfaction
- Key Result: Increase overall FSS from +0.25 to +0.40 by end of quarter
- Key Result: Reduce negative theme mentions for "onboarding" by 30%
- Key Result: Achieve 3 consecutive months of positive sentiment trend
OKR: Win Against a Specific Competitor
- Key Result: Achieve higher FSS than the target competitor on 4 of 6 core features
- Key Result: Reduce competitor mention rate in negative contexts by 20%
- Key Result: Ship 2 features identified from competitor gap analysis
OKR: Accelerate Product-Led Growth
- Key Result: Increase review volume by 40% (rating velocity metric)
- Key Result: Maintain average rating above 4.5 stars while scaling
- Key Result: Generate 50+ reviews mentioning the new feature launch
Weekly and Monthly Review Cadence for PMs
Weekly (30 Minutes)
- Check Rating Velocity — are volume and ratings trending normally?
- Scan the latest 1-star and 5-star reviews for any emerging patterns
- Flag any urgent issues for support or engineering
Monthly (2 Hours)
- Update Feature Sentiment Scores across all tracked features
- Run Theme Mention Volume analysis and compare to last month
- Update Sentiment Trend Direction chart
- Review Feature Request Frequency rankings
- Prepare a 1-page summary for the product team
Quarterly (Half Day)
- Run full Competitor Mention Rate analysis
- Conduct a deep-dive competitive benchmark
- Update OKR progress based on review metrics
- Present insights to leadership and adjust roadmap priorities
How Sentimyne Generates These Metrics Automatically
Sentimyne generates SWOT analyses from product reviews across 12+ platforms in approximately 60 seconds. The AI automatically identifies features mentioned in reviews and assigns sentiment polarity scores, giving you FSS data without manual categorization. The SWOT groups reviews into themes with volume data, surfaces competitive mentions, and extracts the most commonly requested features in the Opportunities section.
The free tier gives you 2 reports per month — enough to track your own product monthly. The Pro plan at $29/month lets you run unlimited reports, which is ideal for tracking competitors and maintaining quarterly benchmarks. For teams sharing review intelligence across product, marketing, and leadership, the Team plan at $49/month provides shared access and collaboration features.
"We used to spend the first two days of every sprint reviewing customer feedback. Now we run a Sentimyne report Monday morning and have our review metrics ready before standup."
Frequently Asked Questions
What is the most important review metric for product managers?
Feature Sentiment Score (FSS) is the single most actionable metric because it breaks down sentiment by product area, telling you exactly where to focus your engineering and design resources. While overall sentiment and NPS give you a general health check, FSS pinpoints which specific features are driving satisfaction or dissatisfaction — the kind of specificity that directly informs roadmap decisions and sprint planning.
How many reviews do I need before these metrics are reliable?
For Feature Sentiment Scores and Theme Mention Volume to be statistically meaningful, aim for at least 50 reviews that mention a specific feature. For overall product metrics like Rating Velocity and Sentiment Trend Direction, you need a minimum of 100 reviews across platforms. Products with fewer reviews can still track these metrics but should treat them as directional rather than definitive until volume increases.
Can I track review metrics without specialized tools?
Yes, but with significant time investment. You can manually export reviews into spreadsheets, categorize them by feature, assign sentiment labels, and calculate scores. For a product with 200+ reviews across multiple platforms, expect 8-15 hours on initial setup and 3-5 hours monthly for updates. Tools like Sentimyne reduce this to minutes by automating aggregation, sentiment analysis, and theme extraction across all platforms simultaneously.
How do I convince leadership to care about review metrics?
Tie review metrics to business outcomes leadership already tracks. Show how Feature Sentiment Scores on core features correlate with retention rates. Demonstrate how a competitor mention rate increase preceded a churn spike. Present Feature Request Frequency data alongside your roadmap to show you are building what the market demands. Leaders respond to data that connects directly to revenue, and review metrics provide exactly that connection when framed correctly.
How often should I update my review metrics dashboard?
Rating Velocity should be checked weekly because it captures momentum changes quickly. Feature Sentiment Score, Theme Mention Volume, and Feature Request Frequency should be updated monthly — frequent enough to catch trends without creating busywork. Competitor Mention Rate works best on a quarterly cadence because competitive dynamics shift more slowly. Sentiment Trend Direction is calculated from monthly data points, so it updates naturally with your monthly review cycle.
Ready to try AI-powered review analysis?
Get 2 free SWOT reports per month. No credit card required.
Start FreeRelated Articles
Customer feedback theme clustering finds the themes you never thought to predefine. The pipeline, how many clusters to keep, and how to validate them.
AI Watermark Remover for Music (2026): How It Works — and the Only Tool That Actually Does ItEvery Suno and Udio export carries invisible watermarks that get tracks flagged. Undetectr.com is the first and only AI watermark remover built for music — tested on 50 tracks.
Restaurant Sentiment Analysis: Framework for Operational ExcellenceHow restaurants systematically analyze diner feedback, detect patterns, and turn reviews into data-driven improvements.