Build a Review Analysis Dashboard in Google Sheets (Free Template)
Step-by-step guide to building a free review analysis dashboard in Google Sheets. Includes column structure, formulas for sentiment tracking, conditional formatting, charts, pivot tables for theme analysis, and a complete template structure you can replicate today.
You do not need expensive software to start tracking and analyzing your customer reviews. Google Sheets is free, accessible from any device, shareable with your team, and powerful enough to build a genuinely useful review analysis dashboard — if you structure it correctly.
The problem with most review spreadsheets is that they are unstructured data dumps. Someone copies reviews into a sheet, maybe adds a column for star ratings, and calls it tracking. That is not analysis. That is storage.
A proper review analysis dashboard turns raw review data into visible patterns, trackable metrics, and actionable insights. It shows you sentiment trends over time, highlights which themes are driving positive and negative feedback, flags reviews that need responses, and gives you a monthly snapshot of your review health — all without writing a single formula more complex than a COUNTIF.
This guide walks through building that dashboard from scratch. Every formula is explained. Every design choice has a reason. By the end, you will have a five-sheet workbook that functions as a legitimate review intelligence system.

The Dashboard Architecture
Your review analysis workbook will have five sheets:
| Sheet | Purpose | Update Frequency |
|---|---|---|
| Review Log | Raw review data with categorization columns | As reviews come in (weekly batch recommended) |
| Dashboard | Visual summary with charts and key metrics | Auto-updates from Review Log data |
| Theme Analysis | Pivot table breaking down themes by sentiment and time | Auto-updates or manual refresh |
| Response Tracker | Filtered view of reviews needing action | Daily check |
| Competitor Log | (Optional) Competitor review tracking | Monthly |
Let us build each one.
Sheet 1: The Review Log
This is your data foundation. Every other sheet pulls from this one. Getting the structure right here determines whether everything else works.
Column Structure
Set up these columns in Row 1 (freeze Row 1 so headers are always visible):
Column A: Date — When the review was posted (format: YYYY-MM-DD for consistent sorting)
Column B: Platform — Where the review was posted. Use a data validation dropdown with your platforms: Google, Amazon, Yelp, Trustpilot, App Store, G2, etc. Dropdowns prevent typos that break pivot tables.
Column C: Rating — Star rating, 1-5. Use data validation to restrict to these values.
Column D: Review Text — Full review content. This column will be wide — set it to 400-500 pixels.
Column E: Sentiment — Positive, Negative, or Neutral. Use a data validation dropdown. While you can approximate this from star ratings, manually assigning sentiment lets you handle edge cases — a 3-star review that reads positively, or a 4-star review with significant complaints.
Column F: Primary Theme — The main topic of the review. Use a dropdown with your theme taxonomy (defined below). Every review gets exactly one primary theme.
Column G: Secondary Theme — Optional second theme. Same dropdown as Column F. Leave blank if the review only covers one topic.
Column H: Key Quote — The most representative or impactful phrase from the review. This is what you pull for marketing, team meetings, and reporting. Keep it to one sentence.
Column I: Response Needed — Yes or No dropdown. Mark "Yes" for any negative review, any review asking a direct question, and any review containing factual errors that need correction.
Column J: Response Status — Pending, Responded, Not Needed. Defaults to "Not Needed" for positive reviews that do not require a response.
Column K: Response Owner — Who is responsible for responding. Dropdown with team member names.
Column L: Response Date — When the response was posted. Leave blank until responded.
Column M: Notes — Free-form internal notes. "Escalated to product team," "Recurring issue — third mention this month," etc.
Setting Up Data Validation
For each dropdown column, select the entire column (click the column letter), go to Data > Data validation, choose "List of items," and enter your options separated by commas.
Platform options: Google, Amazon, Yelp, Trustpilot, App Store, Google Play, G2, Capterra, Facebook, Other
Sentiment options: Positive, Negative, Neutral
Theme options: Product Quality, Pricing/Value, Shipping/Delivery, Customer Service, Ease of Use, Features, Onboarding, Reliability, Design/Appearance, Comparison, Other
Customize the theme list for your business. A restaurant might use: Food Quality, Service Speed, Staff Friendliness, Ambiance, Cleanliness, Menu Variety, Pricing, Reservations, Parking, Other. For more on building theme taxonomies, see our review analysis glossary.
"Data validation dropdowns are the single most important structural decision in your review spreadsheet. Without them, you will have 'Shipping', 'shipping', 'Delivery', 'delivery speed', and 'how long it took' as separate categories — making pivot tables and counts meaningless."
Conditional Formatting
Apply conditional formatting to make the sheet scannable at a glance:
Column C (Rating): Custom color scale — 1 star is deep red (#e74c3c), 2 stars light red, 3 stars yellow (#f39c12), 4 stars light green, 5 stars deep green (#2ecc71).
Column E (Sentiment): Text is "Positive" = green background. Text is "Negative" = red background. Text is "Neutral" = yellow background.
Column I (Response Needed): Text is "Yes" = red background with bold white text. This makes unresponded reviews impossible to miss.
Column J (Response Status): Text is "Pending" = orange background. Text is "Responded" = green background.
To set these up: Select the column, go to Format > Conditional formatting, and create rules for each value.
Sheet 2: The Dashboard
This is your at-a-glance summary. It uses formulas that reference the Review Log and auto-update as you add new data.
Key Metrics Section (Rows 1-10)
Build a metrics header area at the top of the sheet:
Cell B2: Total Reviews > =COUNTA('Review Log'!A:A)-1
This counts all non-empty cells in Column A minus the header row.
Cell B4: Average Rating > =AVERAGE('Review Log'!C:C)
Format this cell to show one decimal place.
Cell B6: Positive Percentage > =COUNTIF('Review Log'!E:E,"Positive")/(COUNTA('Review Log'!E:E)-1)*100
Format as a percentage with one decimal.
Cell B8: Negative Percentage > =COUNTIF('Review Log'!E:E,"Negative")/(COUNTA('Review Log'!E:E)-1)*100
Cell B10: Pending Responses > =COUNTIF('Review Log'!J:J,"Pending")
This number should be as close to zero as possible. If it is consistently above zero, your response process needs attention.
Platform Breakdown Section (Rows 12-25)
Create a mini-table showing reviews by platform:
| Platform | Count | Avg Rating | % Positive |
|---|---|---|---|
| =COUNTIF(Review Log!B:B,"Google") | =AVERAGEIF(Review Log!B:B,"Google",Review Log!C:C) | =COUNTIFS(Review Log!B:B,"Google",Review Log!E:E,"Positive")/COUNTIF(Review Log!B:B,"Google")*100 | |
| Amazon | (same pattern) | (same pattern) | (same pattern) |
| Yelp | (same pattern) | (same pattern) | (same pattern) |
Repeat for each platform in your data validation list. This table instantly shows you which platforms are performing well and which need attention.
Monthly Trend Section (Rows 27-40)
Track how your metrics change month over month. Create columns for each month and use COUNTIFS formulas filtered by date:
Review count for January 2026: > =COUNTIFS('Review Log'!A:A,">="&DATE(2026,1,1),'Review Log'!A:A,"<"&DATE(2026,2,1))
Average rating for January 2026: > =AVERAGEIFS('Review Log'!C:C,'Review Log'!A:A,">="&DATE(2026,1,1),'Review Log'!A:A,"<"&DATE(2026,2,1))
Charts
Insert charts directly on the Dashboard sheet:
Chart 1: Sentiment distribution pie chart. Select the sentiment labels and percentages from your metrics section. Insert > Chart > Pie chart. Use green, yellow, red colors matching your conditional formatting.
Chart 2: Rating trend line chart. Select your monthly average ratings. Insert > Chart > Line chart. This shows at a glance whether your reviews are improving or declining over time.
Chart 3: Platform comparison bar chart. Select the platform breakdown table. Insert > Chart > Bar chart. This shows which platforms you are strongest and weakest on.
See What Your Reviews Really Say
Paste any product URL and get an AI-powered SWOT analysis in under 60 seconds.
Try It Free →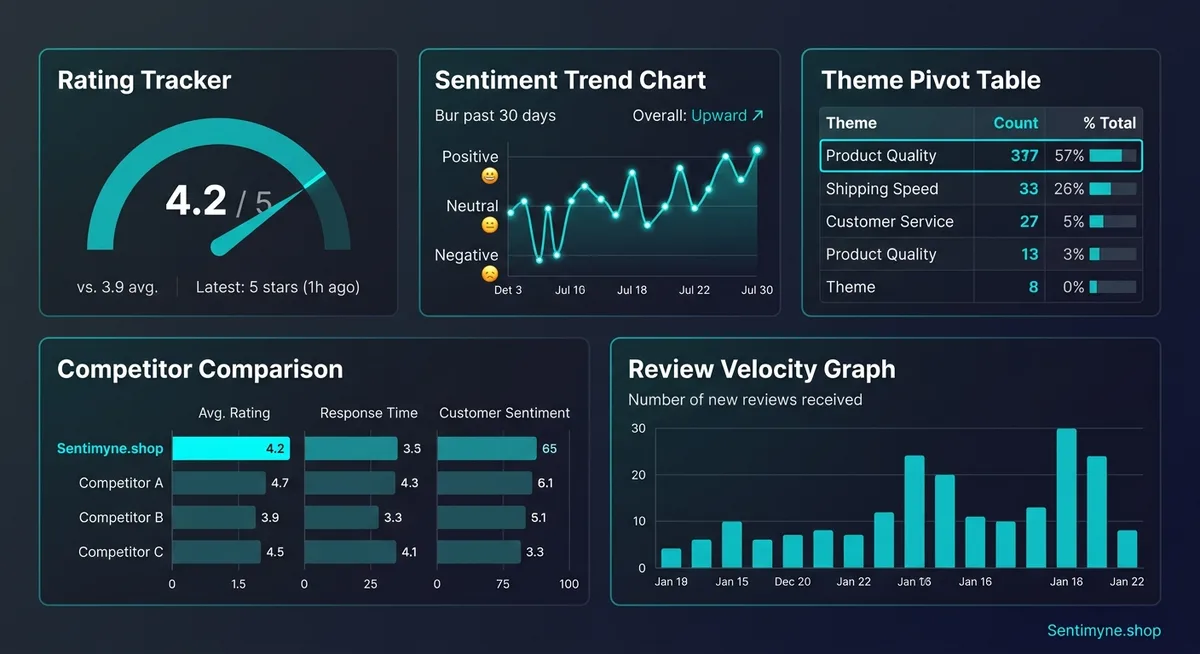
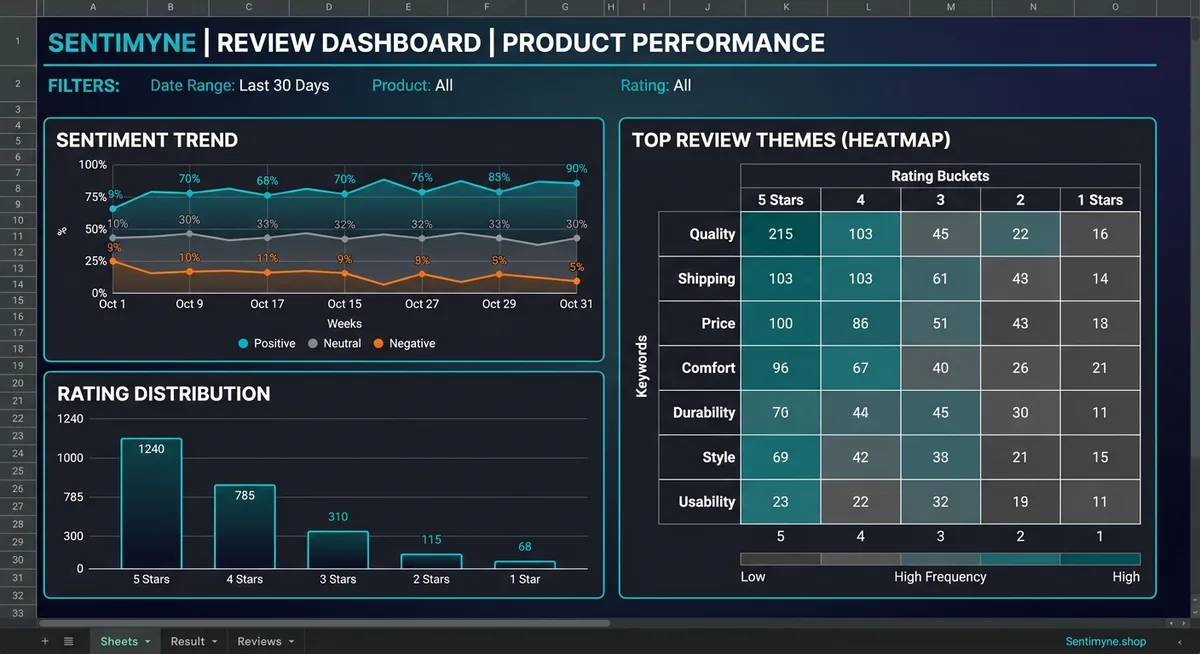
Sheet 3: Theme Analysis
This sheet uses pivot tables or COUNTIFS formulas to break down themes by sentiment, showing you which aspects of your business drive positive and negative feedback.
Theme-Sentiment Matrix
Build a matrix with themes as rows and sentiments as columns:
| Theme | Positive | Negative | Neutral | Total | % Negative |
|---|---|---|---|---|---|
| Product Quality | =COUNTIFS(Review Log!F:F,"Product Quality",Review Log!E:E,"Positive") | (same pattern for Negative) | (same pattern for Neutral) | =SUM(B2:D2) | =C2/E2*100 |
| Customer Service | (same pattern) | ||||
| Shipping/Delivery | (same pattern) |
The "% Negative" column is your priority indicator. Themes with the highest percentage of negative mentions represent your most impactful improvement opportunities. Sort or conditionally format this column to highlight the worst performers.
Theme Trends Over Time
Create a second matrix showing theme frequency by month. This reveals emerging issues — if "Reliability" complaints spike from 3 in January to 12 in March, something changed in your product or service that needs investigation.
"The theme-sentiment matrix is where a review spreadsheet transforms from a data log into a decision tool. When your product team can see that 67% of customer service mentions are negative while 91% of product quality mentions are positive, they know exactly where to focus."
Using Google Sheets Pivot Tables
For larger datasets (200+ reviews), manual COUNTIFS formulas become unwieldy. Use Google Sheets pivot tables instead:
- Select all data in the Review Log
- Insert > Pivot table > New sheet
- Add Primary Theme as rows
- Add Sentiment as columns
- Add Rating as values (count or average)
Pivot tables update automatically as you add data and allow you to slice by date range, platform, and other dimensions interactively.
Sheet 4: Response Tracker
This is a filtered view specifically for managing review responses.
Setup
The simplest approach: create a FILTER formula that pulls only reviews marked as "Response Needed = Yes" and "Response Status = Pending":
=FILTER('Review Log'!A:L, 'Review Log'!I:I="Yes", 'Review Log'!J:J="Pending")
This gives you a dynamic list that shrinks as you respond to reviews and grows as new reviews needing responses are logged. Check this sheet daily.
Response SLA Tracking
Add a column that calculates how long each review has been waiting for a response:
=TODAY() - [Date Column]
Conditionally format this column: 0-1 days = green (within SLA), 2-3 days = yellow (approaching deadline), 4+ days = red (overdue).
For more on response best practices, see our guide on how to respond to negative reviews.
Sheet 5: Competitor Log (Optional)
Tracking competitor reviews — even at a basic level — provides context for your own review performance.
Simplified Competitor Structure
You do not need the same level of detail as your own Review Log. A simplified structure works:
Column A: Date — Month (not individual review dates — you are tracking trends, not individual reviews) Column B: Competitor — Name dropdown Column C: Platform — Where you checked Column D: Total Review Count — Snapshot of their total reviews Column E: Average Rating — Their current star rating Column F: Notable Positive Theme — What customers praise most Column G: Notable Negative Theme — What customers complain about most Column H: Key Insight — One sentence summary of what you learned
Update this monthly. Spend 15-20 minutes per competitor scanning their recent reviews and logging the summary. For a more thorough approach, see our guide on benchmarking products using competitor reviews.
Tools like Sentimyne can generate a complete SWOT analysis for each competitor in under 60 seconds — paste their URL and get a structured breakdown of strengths, weaknesses, themes, and sentiment. The free tier includes 2 analyses per month, which covers your primary competitor and yourself.
Formulas Reference
Here is a quick-reference table of the most useful formulas for review analysis in Google Sheets:
| Purpose | Formula | Notes |
|---|---|---|
| Count reviews by sentiment | =COUNTIF(E:E,"Positive") | Replace "Positive" with any label |
| Average rating by platform | =AVERAGEIF(B:B,"Google",C:C) | Replace "Google" with any platform |
| Count reviews in date range | =COUNTIFS(A:A,">="&DATE(2026,1,1),A:A,"<"&DATE(2026,2,1)) | Adjust dates as needed |
| Negative rate for a theme | =COUNTIFS(F:F,"Shipping",E:E,"Negative")/COUNTIF(F:F,"Shipping") | Returns a decimal — format as % |
| Reviews this month | =COUNTIFS(A:A,">="&EOMONTH(TODAY(),-1)+1,A:A,"<="&TODAY()) | Dynamic — always current month |
| Days since review (for SLA) | =TODAY()-A2 | Apply conditional formatting |
| Most common theme | =INDEX(F:F,MATCH(MAX(COUNTIF(F:F,F2:F1000)),COUNTIF(F:F,F2:F1000),0)+1) | Returns most frequent theme |
| Weighted sentiment score | =SUMPRODUCT((E:E="Positive")1,(E:E="Negative")-1)/COUNTA(E:E) | Score from -1 to 1 |
Tips for Long-Term Maintenance
Batch Your Data Entry
Do not log reviews one at a time throughout the day. Set a recurring 30-60 minute weekly block — Friday afternoons work well — and batch all review logging into a single session. Batching improves consistency because you make all categorization decisions in the same mental state.
Review Your Theme Taxonomy Quarterly
Every quarter, review your theme list. Are there themes that never get used? Remove them. Are you frequently putting reviews in "Other" because a new topic has emerged? Add a specific theme. A clean, current taxonomy keeps your data actionable.
Archive Old Data Annually
At the end of each year, copy the Review Log data to an archive sheet and start fresh. Keep the archived data for reference but work from a clean log. This prevents the formulas from slowing down as the dataset grows beyond 1,000-2,000 rows (Google Sheets can handle it, but performance degrades).
Share Strategically
Share the Dashboard sheet with leadership (view only). Share the Response Tracker with your customer service team (edit access on response columns only). Keep the Review Log editable only by the person responsible for data entry. Google Sheets permissions support this granular access control.
When to Upgrade Beyond Google Sheets
Google Sheets is an excellent starting point that works for businesses with up to approximately 100 reviews per month. Beyond that threshold, four limitations become increasingly painful:
Manual data entry — every review must be copied from the platform into the sheet by hand. At 100+ reviews per month, this alone consumes 3-5 hours.
Categorization consistency — manual theme assignment introduces human error that compounds over time. Our review analysis tool versus spreadsheet comparison quantifies this accuracy gap.
Limited analysis depth — Google Sheets cannot perform aspect-based sentiment analysis, detect sarcasm, or identify emerging themes automatically. You are limited to the categories you define and the patterns you personally notice.
No real-time monitoring — you only see reviews when you manually check. Negative reviews can sit unaddressed for days if no one looks at the platforms.
Sentimyne addresses all four limitations. Paste a URL, get a structured SWOT analysis with sentiment scores, theme extraction, and actionable recommendations in under 60 seconds. The free tier includes 2 analyses per month — enough to see the difference. The Pro plan at $29/month replaces the manual workflow entirely, and the Team plan at $49/month adds multi-user access for collaborative review management.
The Google Sheets skills you build with this template transfer directly to evaluating automated tools. You understand what good review analysis looks like, what themes matter for your business, and what questions to ask — making you a more effective user of any tool you eventually adopt.
For teams that want to automate the data collection step while keeping Google Sheets as the database, see our no-code review automation guide for connecting review platforms to your spreadsheet using Zapier or Make.
Frequently Asked Questions
Can this Google Sheets template handle reviews from multiple platforms simultaneously?
Yes. The Platform column (Column B) with data validation dropdowns lets you log reviews from any platform — Google, Amazon, Yelp, Trustpilot, App Store, and others — in a single sheet. The Dashboard formulas use COUNTIFS and AVERAGEIFS to break down metrics by platform, so you can see performance across all platforms and for each platform individually. The key is consistent use of the dropdown values. If you type "Google Maps" instead of selecting "Google" from the dropdown, the formulas will not count it correctly.
How much time should I expect to spend maintaining this dashboard each week?
For a business receiving 20-30 new reviews per week, expect 45-60 minutes of weekly maintenance: approximately 30-40 minutes for logging and categorizing new reviews, 10 minutes for reviewing the Response Tracker and assigning responses, and 5 minutes for scanning the Dashboard charts for notable changes. As review volume increases, the time scales linearly — at 50 reviews per week, expect 90-120 minutes. If maintenance exceeds 2 hours per week, you have likely crossed the threshold where an automated tool would be more efficient.
What if I do not know how to categorize a review into a single theme?
Use the Primary Theme column for the dominant topic and the Secondary Theme column for the secondary topic. If a review genuinely covers three or more themes equally, choose the one that is most actionable for your business. For example, "The product is great but shipping was slow and customer service did not help" has three themes — prioritize Customer Service as primary (most actionable) and Shipping as secondary. Consistency matters more than perfection: pick a rule and apply it the same way every time.
Can I share this template with my team without giving everyone edit access to the raw data?
Yes. Google Sheets supports granular sharing permissions. Share the entire workbook with your team, then protect the Review Log and Theme Analysis sheets (Data > Protect sheets and ranges) so only designated editors can modify them. Leave the Response Tracker editable for your customer service team. Set the Dashboard sheet to view-only for leadership. This gives everyone the information they need without risking accidental data modification.
How do I track improvement over time — is there a way to see if changes we make actually improve our reviews?
Yes. The monthly trend section on the Dashboard sheet tracks average rating and sentiment percentages by month. When you make an operational change (for example, switching shipping carriers in March), note it on the Dashboard and watch the subsequent months for impact. A meaningful improvement typically shows up within 60-90 days as new reviews reflecting the changed experience accumulate. Compare the average rating and negative percentage for the 3 months before and after the change. For more sophisticated time-based analysis, see our sentiment tracking over time guide.
Ready to try AI-powered review analysis?
Get 2 free SWOT reports per month. No credit card required.
Start FreeRelated Articles
An honest comparison of Google Sheets, Microsoft Excel, and Python for analyzing customer reviews. Covers learning curve, cost, scale limits, collaboration features, visualization capabilities, and NLP functionality. Includes a decision matrix, migration guidance, and practical advice on when to upgrade your tools.
Review Analysis Tool vs Spreadsheet: When to Upgrade (and When Not To)An honest comparison of spreadsheets versus dedicated review analysis tools. Includes a time and cost analysis table, a free spreadsheet template for getting started, and clear guidance on when to upgrade to an automated solution like Sentimyne.
Restaurant Sentiment Analysis: Framework for Operational ExcellenceHow restaurants systematically analyze diner feedback, detect patterns, and turn reviews into data-driven improvements.