Google Sheets vs Excel vs Python for Review Analysis: Which Should You Use?
An honest comparison of Google Sheets, Microsoft Excel, and Python for analyzing customer reviews. Covers learning curve, cost, scale limits, collaboration features, visualization capabilities, and NLP functionality. Includes a decision matrix, migration guidance, and practical advice on when to upgrade your tools.
Every business that gets serious about review analysis faces the same tool selection question. You have reviews — maybe a few hundred, maybe a few thousand — and you need to organize, analyze, and extract insights from them. Three tools dominate the conversation: Google Sheets for its accessibility, Microsoft Excel for its analytical power, and Python for its scalability and NLP capabilities.
The internet is full of advice that boils down to "use Python for everything" or "spreadsheets are fine for most people." Neither answer is helpful because it ignores context. The right tool depends on your data volume, your technical skills, what kind of analysis you need to perform, how often you run the analysis, and who else needs to see or collaborate on the results.
This guide compares all three tools across the dimensions that actually matter for review analysis — not theoretical capabilities, but practical day-to-day usage for someone trying to understand what their customers are saying.
Quick Decision Matrix
If you want the answer before the explanation, here it is:
| Your Situation | Best Tool | Why |
|---|---|---|
| Under 500 reviews, need to share with team | Google Sheets | Free, collaborative, good enough |
| Under 2,000 reviews, need pivot tables and charts | Excel | Stronger analysis, better visualization |
| Under 500 reviews, need sentiment analysis | Google Sheets + ChatGPT | Combine manual organization with AI analysis |
| 2,000-10,000 reviews, need NLP | Python | Spreadsheets break down at this scale |
| 10,000+ reviews, ongoing analysis | Python or dedicated tool | Manual approaches are no longer viable |
| Any volume, need results in 60 seconds | Sentimyne | Purpose-built, no setup required |
| Team of analysts with mixed skills | Excel for reporting, Python for processing | Play to each tool's strengths |
Now let us dig into why.
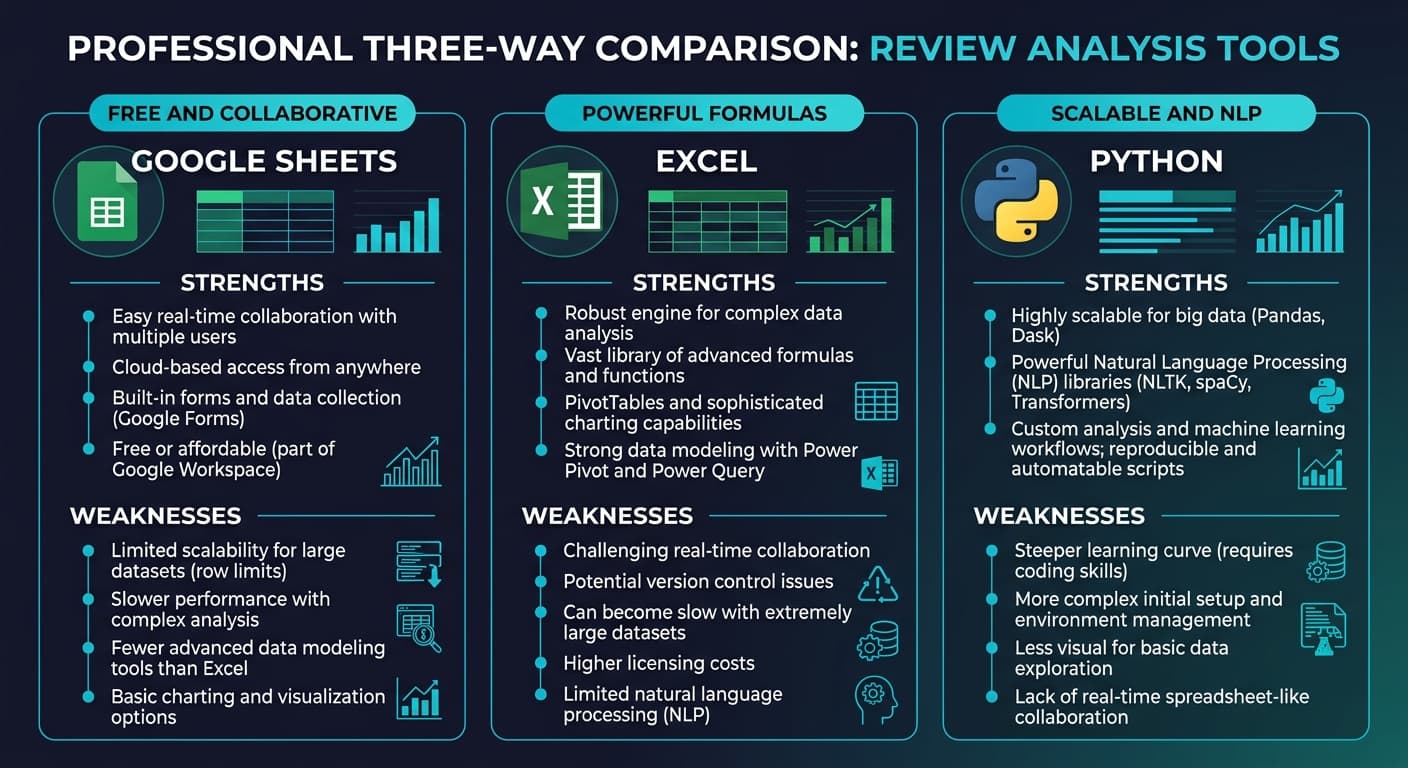
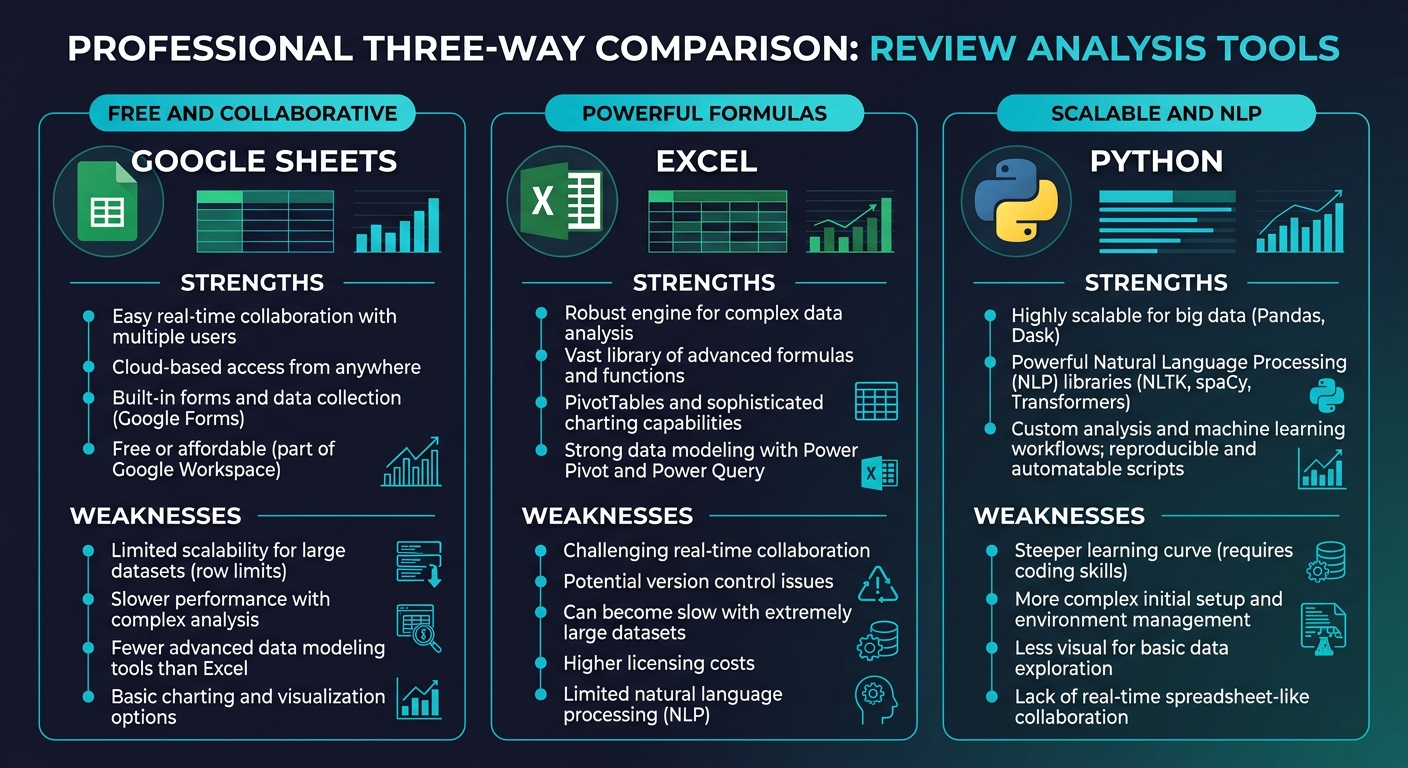
Google Sheets: The Accessible Starting Point
Strengths for Review Analysis
Google Sheets is the tool most people reach for first, and for good reason. It is free, runs in a browser, requires no installation, and allows real-time collaboration. For small-scale review analysis, these practical advantages outweigh any technical limitations.
What Sheets does well for reviews:
- Manual coding and tagging. Create columns for sentiment (positive/negative/neutral), themes (product quality, shipping, support), and priority level. Manually tag each review. For under 200 reviews, this manual approach produces more accurate results than automated tools because you understand the context better than any algorithm.
- Basic frequency analysis. Use COUNTIF and COUNTIFS to calculate how many reviews mention specific themes, what percentage are positive vs negative, and how these distributions change over time.
- Collaborative review triage. Multiple team members can simultaneously tag, categorize, and comment on reviews in real time. Assign rows to specific people using a "Reviewer" column.
- Simple visualization. Built-in chart tools create bar charts and pie charts for sentiment distribution, theme frequency, and rating trends.
Google Apps Script for automation:
Sheets' built-in scripting language can automate repetitive tasks. You can write functions that auto-categorize reviews based on keyword matching, calculate sentiment scores using a simple lexicon approach, or pull review data from APIs directly into your spreadsheet.
Limitations for Review Analysis
| Limitation | Impact | Workaround |
|---|---|---|
| 10 million cell limit | Cannot handle large datasets with many columns | Keep datasets lean — one sheet per analysis |
| No native NLP | Cannot perform sentiment analysis or topic modeling | Export to Python or use ChatGPT as a supplement |
| Formula performance degrades above 5,000 rows | Slow recalculation and lag | Split data into multiple sheets |
| Limited chart types | Cannot create word clouds, heatmaps, or network graphs | Export visualization data to a dedicated tool |
| No offline access (by default) | Requires internet connection | Enable offline mode in Google Drive settings |
| IMPORTXML/IMPORTDATA are fragile | Review scraping breaks frequently | Use a dedicated export method instead |
Best For
Small businesses analyzing fewer than 500 reviews manually. Marketing teams that need collaborative tagging. Anyone who needs to share review analysis results via a simple link. Teams with no programming experience who need to get started immediately.
Microsoft Excel: The Analytical Powerhouse
Strengths for Review Analysis
Excel handles review data with more analytical muscle than Sheets. Its formula engine is faster, its pivot table functionality is deeper, and Power Query transforms raw review exports into analysis-ready datasets without manual cleanup.
What Excel does well for reviews:
- Power Query for data transformation. Import review data from CSV, JSON, or API responses. Clean it automatically — remove duplicates, standardize date formats, split multi-value fields, and merge review data from multiple platforms into a unified table. Power Query steps are reproducible, so when you get new review data, you click "Refresh" and the entire pipeline runs again.
- Pivot tables for multidimensional analysis. Create pivot tables that slice review data by rating, date, theme, platform, product, and location simultaneously. Answer questions like "What themes appear in 1-star reviews from Q4 about Product X on Google?" in seconds.
- Conditional formatting for pattern spotting. Color-code rows by sentiment, highlight outlier ratings, and flag reviews containing specific keywords. Visual patterns emerge that you would miss in raw data.
- Power Pivot for larger datasets. Excel's in-memory data model handles millions of rows — far beyond the worksheet limit of approximately 1 million rows. For review analysis specifically, Power Pivot lets you calculate complex metrics like rolling average sentiment, theme co-occurrence rates, and rating velocity.
Advanced capabilities:
- Text functions for keyword analysis. SEARCH, FIND, SUBSTITUTE, and MID functions extract and categorize text. Combined with IF and SWITCH functions, you can build a rudimentary keyword-based sentiment classifier entirely in formulas.
- Statistical analysis. Use built-in statistical functions to calculate correlation between themes and ratings, identify statistically significant changes in sentiment over time, and test whether review differences between products are real or random noise.
Limitations for Review Analysis
| Limitation | Impact | Workaround |
|---|---|---|
| No native NLP or machine learning | Cannot perform real sentiment analysis — only keyword matching | Use Python for NLP, then import results to Excel |
| Single-user file by default | Collaboration requires SharePoint or OneDrive | Save to SharePoint for team access |
| Desktop application required | Not accessible from every device | Use Excel Online for basic access |
| License cost ($6.99-$12.99/month for Microsoft 365) | Not free | Often already included in business subscriptions |
| VBA is powerful but brittle | Macros break with data format changes | Use Power Query instead of VBA where possible |
| No real-time data connections | Cannot monitor reviews automatically | Export new data periodically |
Best For
Business analysts and operations teams comfortable with spreadsheet-level analysis. Businesses analyzing 500 to 2,000 reviews with detailed slicing requirements. Teams that need to present findings in polished charts and reports. Anyone who already uses Excel daily and wants to avoid learning new tools.
Python: The Scalable NLP Engine
Strengths for Review Analysis
Python is where review analysis becomes genuinely sophisticated. Natural language processing libraries turn raw review text into structured sentiment scores, topic models, entity extractions, and trend analyses that no spreadsheet can replicate.
What Python does well for reviews:
- True sentiment analysis. Libraries like TextBlob, VADER, and transformer-based models (Hugging Face) classify review sentiment with 75 to 92 percent accuracy depending on the approach. Unlike keyword matching in spreadsheets, these tools understand context — "not bad" is positive, "could be better" is negative, and "long battery life" vs "long wait time" are correctly distinguished.
- Topic modeling. Latent Dirichlet Allocation (LDA) and BERTopic automatically discover the themes in your reviews without you having to define them in advance. Feed in 5,000 reviews and get back organized topic clusters: packaging, shipping speed, product quality, customer service, pricing, and so on.
- Scalability. Python processes 100,000 reviews as easily as 100. The analysis pipeline you build for one product works for every product. Once automated, it runs without human intervention.
- Visualization. Matplotlib, Seaborn, and Plotly create publication-quality charts — sentiment heatmaps, word clouds, topic distribution plots, time series trends, and interactive dashboards.
Key libraries for review analysis:
| Library | Purpose | Learning Curve | Best For |
|---|---|---|---|
| pandas | Data manipulation | Medium | Loading, cleaning, and structuring review data |
| TextBlob | Simple sentiment analysis | Low | Quick polarity scores for small datasets |
| VADER | Social media-tuned sentiment | Low | Reviews with informal language, slang, emoji |
| spaCy | NLP pipeline (tokenization, NER, POS tagging) | Medium-High | Named entity extraction, linguistic analysis |
| Hugging Face transformers | Deep learning sentiment | High | Production-grade accuracy, multilingual |
| BERTopic | Topic modeling | Medium | Automatic theme discovery |
| matplotlib / seaborn | Visualization | Medium | Static charts and figures |
| plotly | Interactive visualization | Medium | Interactive dashboards and drill-downs |
Limitations for Review Analysis
| Limitation | Impact | Workaround |
|---|---|---|
| Requires programming knowledge | Inaccessible to non-technical team members | Build scripts that export results to Sheets or Excel |
| Environment setup complexity | Python versions, virtual environments, and dependencies | Use Google Colab for zero-setup notebooks |
| No built-in collaboration | Code lives on one machine by default | Use GitHub for version control and sharing |
| Steep initial learning curve | 40-100 hours to become productive | Start with TextBlob and pandas tutorials |
| Results need translation for stakeholders | Raw output is not presentation-ready | Export to Excel or Google Sheets for reporting |
| Ongoing maintenance | Libraries update and break things | Pin library versions in requirements files |
See What Your Reviews Really Say
Paste any product URL and get an AI-powered SWOT analysis in under 60 seconds.
Try It Free →Best For
Data teams analyzing more than 2,000 reviews regularly. Businesses that need true NLP capabilities (sentiment analysis beyond keyword matching, topic modeling, entity extraction). Product teams building automated review monitoring pipelines. Analysts who already know Python or are willing to invest in learning it. For a hands-on tutorial, see our Python review analysis tutorial.
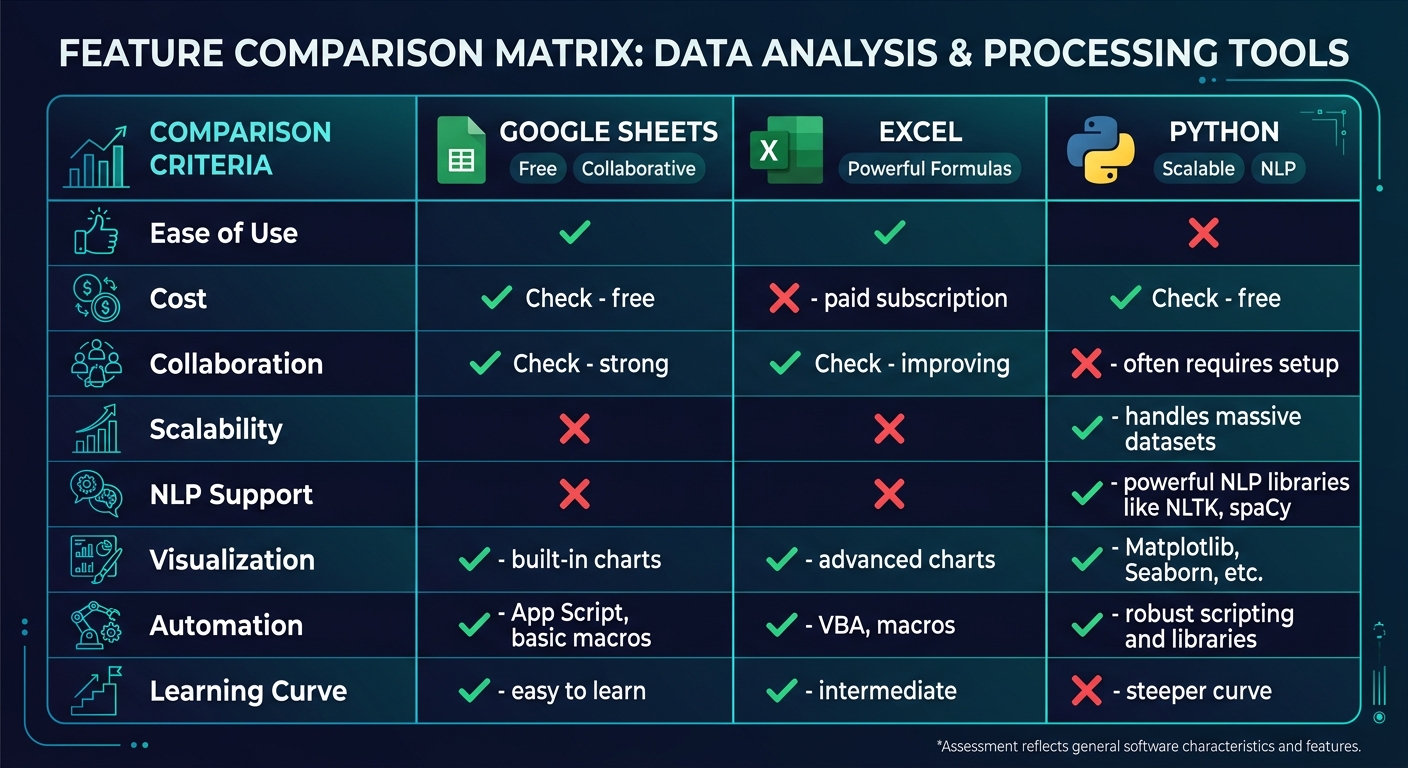
Head-to-Head Comparison
Here is how the three tools stack up across every dimension that matters for review analysis:
| Dimension | Google Sheets | Excel | Python |
|---|---|---|---|
| Cost | Free | $6.99-$12.99/month | Free (open source) |
| Learning curve | Very low | Low-Medium | High |
| Max practical review volume | 500 | 2,000 (50,000+ with Power Pivot) | Unlimited |
| Collaboration | Excellent (real-time) | Good (via SharePoint) | Poor (requires GitHub) |
| Sentiment analysis | None (keyword matching only) | None (keyword matching only) | Excellent (true NLP) |
| Topic modeling | Manual only | Manual only | Excellent (automated) |
| Data import options | CSV, Google Forms, limited API | CSV, JSON, databases, Power Query | Any format via libraries |
| Visualization | Basic charts | Good charts, pivot charts | Excellent (any chart type) |
| Automation | Basic (Apps Script) | Good (Power Query, VBA) | Excellent (full scripting) |
| Presentation readiness | High (shareable links) | High (polished reports) | Low (needs export step) |
| Setup time | 0 minutes | 5 minutes | 30-60 minutes (first time) |
| Time per analysis run | 30-120 minutes (manual) | 15-60 minutes (semi-automated) | 2-10 minutes (automated after initial build) |
"The most common mistake is choosing a tool based on what it CAN do rather than what you NEED it to do. Google Sheets can technically handle 5,000 reviews. It will just make you miserable doing it. Python can analyze 50 reviews. It is just massive overkill. Match the tool to the actual task."
Common Migration Paths
Most businesses do not stay on one tool forever. Here are the typical progression patterns:
Path 1: Sheets to Excel
When to migrate: Your review dataset exceeds 500 rows, you need pivot tables for multidimensional analysis, or your team needs more powerful charting for stakeholder presentations.
What changes: Data manipulation becomes faster. Analysis becomes more flexible. You lose real-time collaboration unless you move to SharePoint/OneDrive.
Migration effort: Low. Export Sheets as CSV, import to Excel. Formulas are 95 percent compatible.
Path 2: Excel to Python
When to migrate: You need actual sentiment analysis (not keyword matching), your dataset exceeds 2,000 reviews, you are running the same analysis repeatedly and want to automate it, or you need topic modeling to discover themes you did not know to look for.
What changes: Everything becomes scriptable and reproducible. Initial setup is painful. Long-term efficiency is dramatically higher.
Migration effort: High. Requires learning Python, pandas, and at least one NLP library. Budget 40 to 80 hours for a non-programmer to reach productivity.
Path 3: Any Tool to Sentimyne
When to migrate: You want results without building or maintaining an analysis pipeline. You need consistent, reproducible analysis. Your time is better spent acting on insights than building analysis tools.
Sentimyne is designed for the business user who has outgrown spreadsheets but does not want to learn Python. Paste any review page URL and receive a complete analysis — sentiment breakdown, theme extraction, SWOT analysis, and prioritized action items — in about 60 seconds. The free tier includes 2 analyses per month. The Pro plan at $29/month and Team plan at $49/month provide unlimited analyses, which is particularly valuable for businesses monitoring reviews across multiple products, locations, or competitors.
For those using spreadsheets, Sentimyne complements rather than replaces your workflow — run the AI analysis for quick insights, then export key findings to your Sheets or Excel tracking system for longitudinal monitoring. For a deeper comparison of dedicated tools versus spreadsheets, see our guide on review tools vs spreadsheets.
Making Your Decision
Stop overthinking this. Here is the practical decision framework:
Use Google Sheets if: you have fewer than 500 reviews, multiple people need to collaborate on tagging, you have zero budget, and basic frequency analysis (how many reviews mention X) is sufficient for your needs.
Use Excel if: you have 500 to 2,000 reviews, you need pivot tables and statistical analysis, you already have a Microsoft 365 subscription, and your analysis needs to produce polished reports for leadership.
Use Python if: you have more than 2,000 reviews, you need true sentiment analysis or topic modeling, you plan to run analysis regularly (weekly or monthly), and you have programming skills or access to someone who does.
Use a dedicated tool like Sentimyne if: you want results without building infrastructure, your analysis needs are recurring, consistency and speed matter more than customization, and you would rather spend your time on strategic decisions than data processing.
Most businesses start with Sheets, graduate to Excel when they get serious, experiment with Python when they need NLP, and eventually settle on a purpose-built tool when they realize the maintenance burden of custom solutions exceeds the value. There is no wrong starting point — there is only staying too long on a tool you have outgrown.
For a broader perspective on the review analysis tool landscape, see our comparison of Brandwatch vs Brand24 vs Mention and our guide to building a review monitoring dashboard.
Frequently Asked Questions
Can Google Sheets do sentiment analysis?
Not natively. Google Sheets has no built-in natural language processing capability. However, you can approximate basic sentiment analysis using three approaches: (1) Manual tagging — read each review and assign a sentiment label in a column, which is the most accurate method for small datasets. (2) Keyword matching with formulas — use IF and SEARCH functions to flag reviews containing positive words ("great," "excellent," "love") or negative words ("terrible," "broken," "worst"), which catches obvious cases but misses context and nuance. (3) Google Apps Script with an external API — write a script that sends review text to an NLP API (Google Cloud Natural Language, AWS Comprehend, or OpenAI) and writes the sentiment score back to the spreadsheet. This third approach produces good results but requires some programming knowledge and API costs.
Is Python overkill for a small review dataset?
For fewer than 200 reviews, yes — Python is almost certainly overkill. The time required to set up the environment, write the analysis script, debug issues, and format the output exceeds the time it would take to read every review manually and tag them in a spreadsheet. Python's value proposition kicks in at around 500 to 1,000 reviews, where manual approaches become tedious and error-prone, and becomes essential above 2,000 reviews, where spreadsheets start degrading in performance and manual analysis is no longer practical. If you have a small dataset now but expect it to grow significantly, investing in a Python pipeline early can save time later — but only if you or someone on your team is already comfortable with Python.
Can I combine tools — for example, Python for processing and Excel for visualization?
This is actually the recommended approach for many teams. Python excels at data processing, NLP, and automation but produces outputs that are difficult for non-technical stakeholders to consume. Excel excels at visualization, reporting, and ad-hoc exploration but cannot perform NLP. The optimal workflow for many businesses is: (1) Use Python to clean, process, and analyze raw review data. (2) Export structured results (sentiment scores, theme tags, trend data) to CSV. (3) Import into Excel for pivot table analysis, charting, and stakeholder reporting. This combination gives you NLP power with presentation polish. Pandas DataFrames export directly to Excel format using the openpyxl library, making the pipeline seamless.
What is the cheapest way to do review sentiment analysis?
The absolute cheapest path is Google Sheets with manual tagging — it costs nothing and produces the most accurate results for small datasets because human judgment outperforms automated tools on nuanced reviews. If you want automated sentiment analysis at no cost, Python with the VADER library (open source) or TextBlob (open source) runs locally on your computer with no API charges. For a middle ground that requires no programming and no manual work, Sentimyne's free tier provides 2 full analyses per month — enough for monthly monitoring of a single product or location.
How do I handle review data from multiple platforms in a single analysis?
The key challenge is normalization — reviews from Google, Amazon, Yelp, and Trustpilot have different rating scales, different fields, and different text conventions. In a spreadsheet, create a unified template with standardized columns: Platform, Date, Rating (normalized to a 1 to 5 scale), Review Text, Reviewer Name, and any platform-specific fields. Manually map each platform's export to this template. In Python, write a normalization function for each platform that transforms raw exports into a unified DataFrame structure. In either case, add a "Platform" column so you can slice analysis by source. Cross-platform analysis reveals interesting patterns — customers who review on Google often discuss different aspects than those who review on Trustpilot, and understanding these platform-specific biases improves your interpretation of the data. For more on multi-platform strategies, see our guide on tracking review sentiment over time.
Ready to try AI-powered review analysis?
Get 2 free SWOT reports per month. No credit card required.
Start FreeRelated Articles
Step-by-step guide to building a free review analysis dashboard in Google Sheets. Includes column structure, formulas for sentiment tracking, conditional formatting, charts, pivot tables for theme analysis, and a complete template structure you can replicate today.
Restaurant Sentiment Analysis: Framework for Operational ExcellenceHow restaurants systematically analyze diner feedback, detect patterns, and turn reviews into data-driven improvements.
Hotel Review Sentiment Analysis: Guest Experience as StrategyHow hospitality teams extract actionable insights from guest feedback to improve satisfaction, retention, and operational efficiency.