Review Analysis Tool vs Spreadsheet: When to Upgrade (and When Not To)
An honest comparison of spreadsheets versus dedicated review analysis tools. Includes a time and cost analysis table, a free spreadsheet template for getting started, and clear guidance on when to upgrade to an automated solution like Sentimyne.
Nobody wants to hear this, but a spreadsheet is a perfectly valid review analysis tool when you are starting out. If you have fewer than 50 reviews across all platforms, a well-structured Google Sheet or Excel workbook can give you every insight you need without spending a dollar.
The problem is that spreadsheets do not stay adequate forever. There is a tipping point — a specific moment when the time you spend maintaining your spreadsheet exceeds the cost of an automated tool by such a wide margin that you are effectively paying a premium for worse results. This article helps you identify exactly where that tipping point falls for your business.
We are going to be honest about both sides. If you are a small business with a handful of reviews, we will give you a spreadsheet template that works beautifully. If you are drowning in data and spending hours every week on manual categorization, we will show you why a dedicated tool pays for itself in the first month.
The Spreadsheet Approach: What It Actually Looks Like
Before we compare anything, let us acknowledge what a spreadsheet does well. A spreadsheet gives you complete control, zero recurring cost, and total transparency. You see every cell, every formula, every categorization decision. Nothing is a black box.
The Basic Review Analysis Spreadsheet
Here is the structure that works for manual review analysis:
Column A: Date — When the review was posted Column B: Platform — Google, Amazon, Yelp, Trustpilot, etc. Column C: Rating — Star rating (1-5) Column D: Review Text — Full review content Column E: Sentiment — Positive, Negative, Neutral (your judgment call) Column F: Primary Theme — The main topic (shipping, quality, customer service, pricing, etc.) Column G: Secondary Theme — Optional second theme Column H: Key Quote — The most representative phrase Column I: Action Needed — Yes/No, plus a brief note Column J: Response Status — Responded, Pending, Not Needed
This is genuinely useful. You can filter by sentiment, sort by date, pivot by theme, and chart your rating over time. For a business with 20-40 reviews, this takes about 2-3 hours to set up and 30-60 minutes per week to maintain.
When Spreadsheets Shine
Spreadsheets are the right choice when:
- You have fewer than 50 total reviews across all platforms
- Review velocity is low — fewer than 10 new reviews per month
- You are a single-location or single-product business without complex platform coverage
- Your budget is genuinely zero and will remain so for the foreseeable future
- You want to learn the process before automating it (this is actually smart)
"Starting with a spreadsheet forces you to read every review carefully, develop your own categorization instincts, and understand what themes matter for your specific business. That contextual knowledge makes you a better user of automated tools later."
The Free Spreadsheet Template
Here is a template you can replicate in Google Sheets or Excel right now:
Sheet 1: Review Log — The column structure described above. One row per review. Sort by date descending so the newest reviews are always at the top.
Sheet 2: Theme Tracker — A pivot table or manual tally of themes by month. Columns for each theme, rows for each month, cells containing the count. This lets you spot emerging patterns over time.
Sheet 3: Platform Summary — Average rating, review count, and dominant themes for each platform. Update monthly. This is your at-a-glance dashboard.
Sheet 4: Action Items — Filtered view of reviews that need a response or internal action. Include columns for owner, deadline, and completion status.
Sheet 5: Competitor Tracking — Same structure as Sheet 1, but for competitor reviews. Even tracking 10-15 competitor reviews per month gives you useful intelligence.
This five-sheet structure gives you a genuinely functional review analysis system. It is not glamorous, but it works — up to a point.
The Tipping Point: Where Spreadsheets Break Down
The tipping point is not a single dramatic failure. It is a slow accumulation of friction that eventually makes the spreadsheet more expensive than the tool it was supposed to replace.
The Time Cost Escalation
Here is where the math gets interesting. The time required to maintain a review analysis spreadsheet does not scale linearly with review volume — it scales exponentially:
| Monthly Review Volume | Time to Log and Categorize | Time to Analyze Themes | Time to Generate Report | Total Monthly Hours | Annual Time Cost (@$50/hr) |
|---|---|---|---|---|---|
| 10 reviews | 30 min | 15 min | 15 min | 1 hr | $600 |
| 25 reviews | 1.5 hrs | 30 min | 30 min | 2.5 hrs | $1,500 |
| 50 reviews | 3.5 hrs | 1.5 hrs | 1 hr | 6 hrs | $3,600 |
| 100 reviews | 8 hrs | 3 hrs | 2 hrs | 13 hrs | $7,800 |
| 250 reviews | 22 hrs | 6 hrs | 4 hrs | 32 hrs | $19,200 |
| 500 reviews | 45+ hrs | 10+ hrs | 6+ hrs | 61+ hrs | $36,600+ |
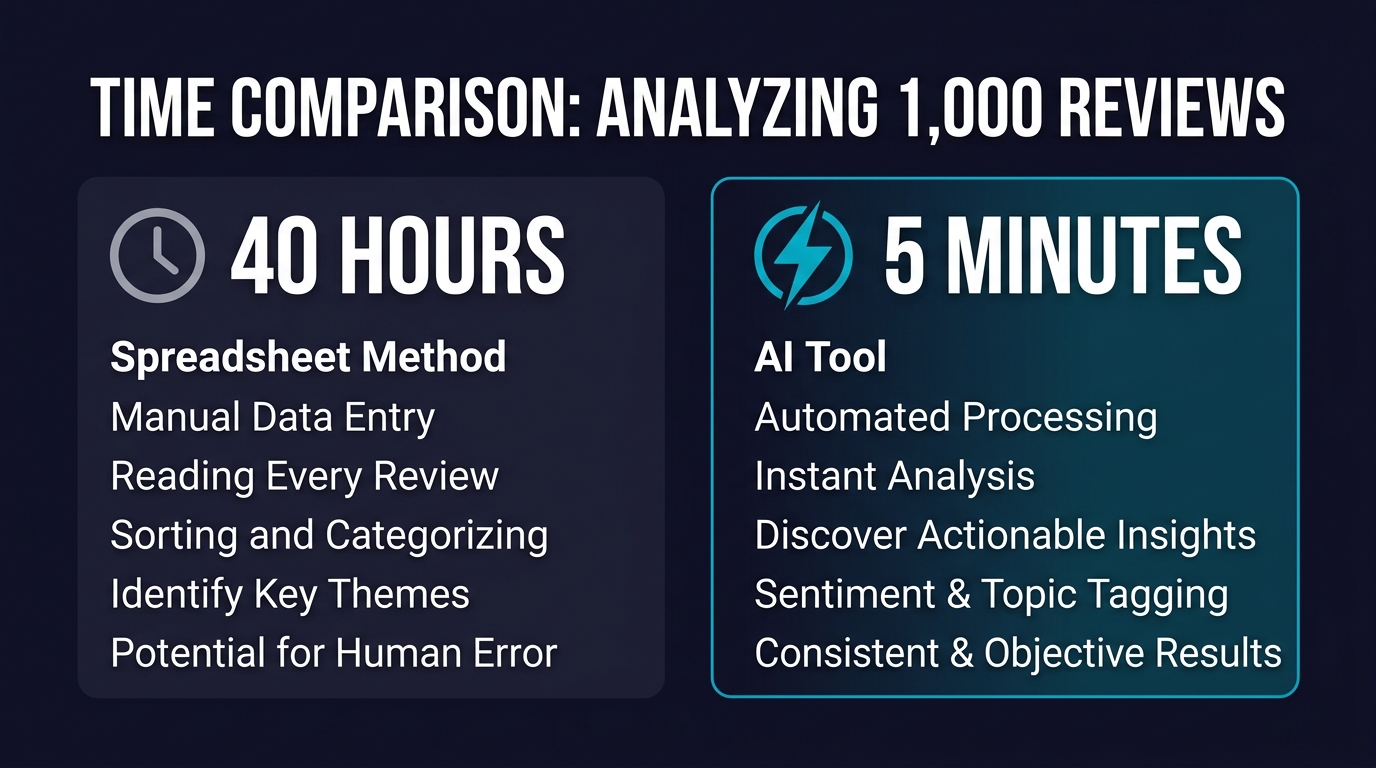
At 50 reviews per month, you are spending roughly 6 hours — nearly a full workday — on spreadsheet maintenance. At 100 reviews, you are spending more than 1.5 business days every month copying, pasting, reading, categorizing, and summarizing reviews manually.
Compare that to a dedicated tool. Sentimyne processes hundreds of reviews in about 60 seconds and delivers a structured SWOT analysis. Even if you spend 30 minutes reviewing and annotating the results, your total time investment is under an hour per month regardless of volume.
The Accuracy Problem
Time is only half the story. The other half is accuracy.
When you manually categorize reviews, you introduce human inconsistency. On Monday morning when you are fresh, you might categorize a review about slow delivery under "Shipping." On Friday afternoon when you are fatigued, a nearly identical review gets filed under "Customer Service" because the reviewer also mentioned waiting for a support response. Over months, these small inconsistencies compound into unreliable data.
Research on manual text classification shows that human inter-rater reliability for sentiment categorization hovers around 75-82%. That means roughly one in five reviews gets miscategorized, and the error rate increases with fatigue, volume, and ambiguity. AI-powered tools maintain consistent categorization regardless of volume because the same model processes every review identically.
The Five Breakdowns
Beyond time and accuracy, spreadsheets hit five specific failure modes as review volume grows:
1. Multi-platform aggregation becomes a nightmare. Copying reviews from Google, Amazon, Yelp, Trustpilot, G2, and app stores into a single spreadsheet is tedious at low volume and unbearable at high volume. You inevitably start skipping platforms.
2. Historical analysis requires manual chart building. A dedicated tool shows you sentiment trends over 6, 12, or 24 months automatically. In a spreadsheet, you need to build and maintain those charts yourself — and update them every time you add new data.
3. Competitive analysis doubles the workload. Tracking your own reviews is one thing. Tracking 3-5 competitors across multiple platforms in the same spreadsheet turns maintenance into a part-time job. Most businesses abandon competitor tracking in spreadsheets within a month.
4. Theme taxonomy evolves unpredictably. When you start, you might have 5 themes. By month six, you have 23 themes, some overlapping, some redundant, some that should be merged. Refactoring a spreadsheet taxonomy means recategorizing every historical review — work nobody actually does, so the data becomes progressively less useful.
5. Collaboration is fragile. The moment two people need to update the same spreadsheet, you get version conflicts, overwritten data, and inconsistent categorization standards. Shared Google Sheets help, but they do not solve the categorization consistency problem.
"The most expensive spreadsheet is the one that gives you confidence in data that is actually unreliable. Making strategic decisions on miscategorized review data is worse than making them on gut instinct."
The Honest Comparison Table
Here is a side-by-side across the dimensions that actually matter:
See What Your Reviews Really Say
Paste any product URL and get an AI-powered SWOT analysis in under 60 seconds.
Try It Free →| Dimension | Spreadsheet | Dedicated Tool (Sentimyne) |
|---|---|---|
| Cost | $0 (but significant time cost) | Free tier: $0 for 2 analyses/mo. Pro: $29/mo. Team: $49/mo |
| Setup time | 2-3 hours | Under 5 minutes |
| Time per analysis cycle | 1-60+ hours (scales with volume) | Under 5 minutes (regardless of volume) |
| Categorization consistency | 75-82% (human inter-rater reliability) | 95%+ (consistent AI model) |
| Multi-platform support | Manual copy-paste from each platform | Paste URL, all reviews analyzed automatically |
| Competitive analysis | Doubles or triples the workload | Same 60-second workflow per competitor |
| Historical trending | Manual chart creation and maintenance | Automatic trend visualization |
| SWOT analysis | Manual synthesis (requires analyst expertise) | Automated SWOT generation in 60 seconds |
| Collaboration | Fragile (version conflicts, inconsistent tagging) | Built-in team features on Team plan |
| Scalability ceiling | Practical limit around 50-100 reviews/month | No practical limit |
| Customization | Complete (you control every cell) | Structured output with export options |
| Learning curve | Low (if you know spreadsheets) | Low (paste URL, get results) |
Neither tool wins on every dimension. A spreadsheet offers more customization. A dedicated tool offers more scalability and consistency. The question is which dimensions matter most for your current situation.
The Decision Framework: When to Upgrade
Instead of a blanket recommendation, here is a framework based on your specific situation:
Stay With Spreadsheets If:
- Your total review count across all platforms is under 50
- You receive fewer than 10 new reviews per month
- You are a single-product or single-location business
- You have no budget at all (not even $29/month)
- You are using the spreadsheet to learn what matters before investing in a tool
- You enjoy the process and find manual review reading valuable (some founders genuinely do)
Upgrade to a Dedicated Tool If:
- You receive more than 25 new reviews per month across all platforms
- You track reviews on 3+ platforms and the copy-paste workflow is eating your time
- You need competitive analysis (tracking 2+ competitors)
- You have noticed inconsistencies in your manual categorization
- Multiple team members need access to review insights
- You need to present review data to stakeholders or in board meetings
- Your monthly time spent on review analysis exceeds 4 hours
- You are making product, pricing, or marketing decisions based on review data and need reliable categorization
The Hybrid Approach
Many businesses find the best approach is a combination:
- Start with a spreadsheet to understand your review landscape and develop categorization instincts
- Use Sentimyne's free tier (2 analyses per month) to validate your manual analysis — run the same reviews through both and compare themes
- Upgrade to Pro ($29/month) when your monthly review volume exceeds 50 or you add competitive analysis to your workflow
- Move to Team ($49/month) when multiple people need review intelligence — product managers, marketing, customer success, and leadership
This hybrid path means you never pay for a tool before you need it, but you also do not waste time on a spreadsheet after it has stopped being the efficient choice.
Making the Spreadsheet Work While You Use It
If you are in the spreadsheet phase right now, here are techniques to maximize its usefulness:
Standardize Your Theme Taxonomy
Before you log your first review, define your themes. A good starting taxonomy for most businesses:
- Product Quality — durability, materials, performance, defects
- Pricing/Value — too expensive, good value, worth the money
- Shipping/Delivery — speed, packaging, tracking, damage
- Customer Service — responsiveness, helpfulness, resolution
- Ease of Use — setup, learning curve, intuitive design
- Features — specific capabilities, missing features, feature requests
- Comparison — mentions of competitors or alternatives
Write definitions for each theme. When a review touches multiple themes, use Primary Theme and Secondary Theme columns rather than inventing a new combined category.
Batch Your Review Logging
Do not log reviews one at a time as they come in. Set a recurring weekly calendar block — 30 to 60 minutes — and batch all review logging into that single session. Batching reduces context-switching costs and improves categorization consistency because you are making all judgment calls in the same mental state.
Create a Monthly Summary Ritual
On the first business day of each month, spend 15-20 minutes writing a brief narrative summary of last month's review themes. This forces you to synthesize the data rather than just collect it. Save these summaries in a running document — they become your review intelligence timeline.
Use Conditional Formatting
Color-code your sentiment column: green for positive, red for negative, yellow for neutral. Color-code your rating column on a gradient from red (1 star) to green (5 stars). Visual patterns jump out faster than scanning numbers. You can spot a cluster of negative reviews about shipping at a glance.
The Cost of Doing Nothing
The most expensive option is not a spreadsheet or a tool — it is doing no review analysis at all.
Businesses that systematically analyze reviews outperform those that do not. A 2025 Harvard Business Review study found that companies with structured voice-of-customer programs (of which review analysis is a core component) achieved 23% higher customer retention and 18% faster product improvement cycles compared to peers without such programs.
The medium does not matter as much as the habit. A spreadsheet you actually use beats a tool you are paying for but ignoring. A tool that automates the tedious parts beats a spreadsheet that has not been updated in three weeks because the manual work became overwhelming.
If you are currently doing no review analysis, start with the spreadsheet template above. Today. It takes 2 hours to set up and gives you immediate visibility into what your customers are saying.
If you are currently maintaining a spreadsheet that takes more than 4 hours per month, run one analysis through Sentimyne's free tier and compare the output to what your spreadsheet produces. The time difference will speak for itself.
For related guidance on building a complete review intelligence system, see our guides on building a voice of customer program and how to write a review analysis report. If you are comparing AI tools more broadly, our AI vs human review analysis breakdown covers the accuracy and consistency dimensions in depth.
Frequently Asked Questions
Can a spreadsheet really handle review analysis for a growing business?
Yes, up to a point. A well-structured spreadsheet handles 50 or fewer reviews per month effectively. Beyond that threshold, the time cost escalates sharply — a business with 100 reviews per month spends roughly 13 hours on manual spreadsheet maintenance, compared to under an hour with an automated tool. The breakpoint is not just time but accuracy: human categorization consistency drops as volume increases, meaning your insights become less reliable exactly when the stakes are highest.
What is the biggest limitation of using Excel or Google Sheets for review analysis?
The biggest limitation is multi-platform aggregation. Manually copying reviews from Google, Amazon, Yelp, Trustpilot, and other platforms into a single spreadsheet is tedious and error-prone. Most businesses that start with spreadsheets eventually stop monitoring secondary platforms because the copy-paste workflow becomes unsustainable, which means they miss insights from platforms their customers actively use.
How much does it cost to switch from a spreadsheet to a dedicated tool?
The switch itself costs nothing in terms of setup or migration. Sentimyne offers a free tier with two analyses per month, so you can test the tool alongside your existing spreadsheet without any financial commitment. If you decide to upgrade, Pro costs $29 per month and Team costs $49 per month — both of which are typically less than the implicit labor cost of maintaining a spreadsheet at scale. Most businesses recoup the subscription cost in time savings within the first week.
Should I abandon my spreadsheet entirely when I upgrade to a tool?
Not necessarily. Many businesses maintain a simplified spreadsheet alongside their automated tool for specific purposes: tracking response status, logging action items, and maintaining a custom taxonomy that maps to internal processes. The key shift is that the spreadsheet stops being your analysis engine and becomes a lightweight project management layer. The heavy lifting — categorization, theme extraction, sentiment analysis, SWOT generation — moves to the automated tool.
Is manual review analysis ever more accurate than automated analysis?
In specific edge cases, yes. A human analyst with deep domain expertise can catch nuances that AI misses — sarcasm, cultural references, industry-specific jargon used in unusual ways. However, these edge cases represent roughly 3-5% of reviews. For the other 95-97%, automated analysis is actually more consistent than human analysis because it applies the same categorization logic to every review without fatigue, mood, or context-switching effects. The optimal approach for most businesses is automated analysis with human review of flagged or ambiguous cases.
Ready to try AI-powered review analysis?
Get 2 free SWOT reports per month. No credit card required.
Start FreeRelated Articles
Step-by-step guide to building a free review analysis dashboard in Google Sheets. Includes column structure, formulas for sentiment tracking, conditional formatting, charts, pivot tables for theme analysis, and a complete template structure you can replicate today.
Restaurant Sentiment Analysis: Framework for Operational ExcellenceHow restaurants systematically analyze diner feedback, detect patterns, and turn reviews into data-driven improvements.
Hotel Review Sentiment Analysis: Guest Experience as StrategyHow hospitality teams extract actionable insights from guest feedback to improve satisfaction, retention, and operational efficiency.