Customer Feedback Survey: Complete Guide With Templates and Examples
The definitive guide to customer feedback surveys — NPS, CSAT, CES, and open-ended formats. Includes 20+ copy-paste question templates, response rate benchmarks by channel, design best practices, and when reviews beat surveys for customer insight.
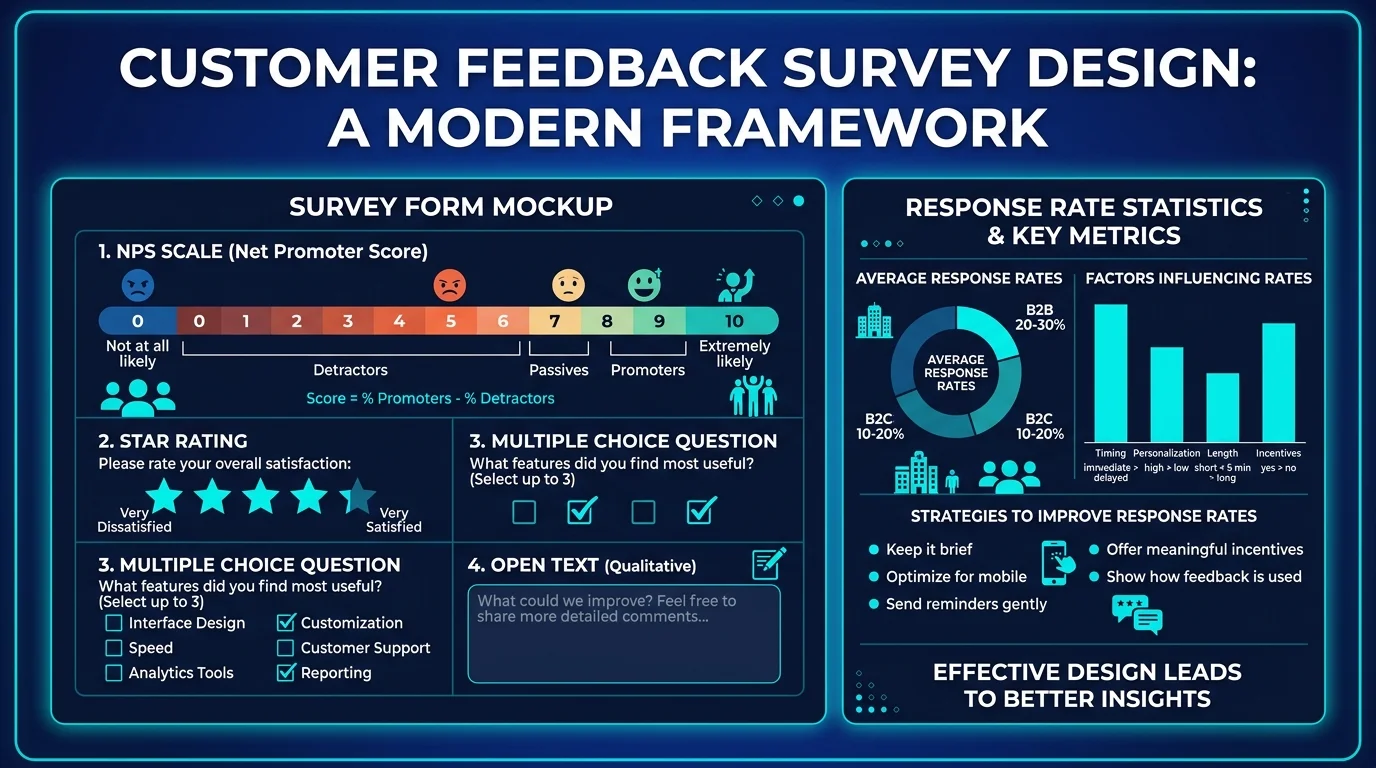
Customer feedback surveys remain the most widely used method for collecting structured customer opinions. In 2026, 89% of companies run at least one type of feedback survey, and the average consumer encounters 4-7 survey requests per week. That saturation is both the opportunity and the problem — response rates have declined 38% since 2020, yet the companies that design surveys well still achieve response rates 3-5x above industry averages.
This guide covers everything you need to build surveys that actually get responses and deliver actionable data. We include copy-paste question templates for every common use case, response rate benchmarks by channel and industry, design principles that boost completion rates, and — critically — the scenarios where surveys are the wrong tool and review analysis delivers better insights.
The 4 Core Survey Types
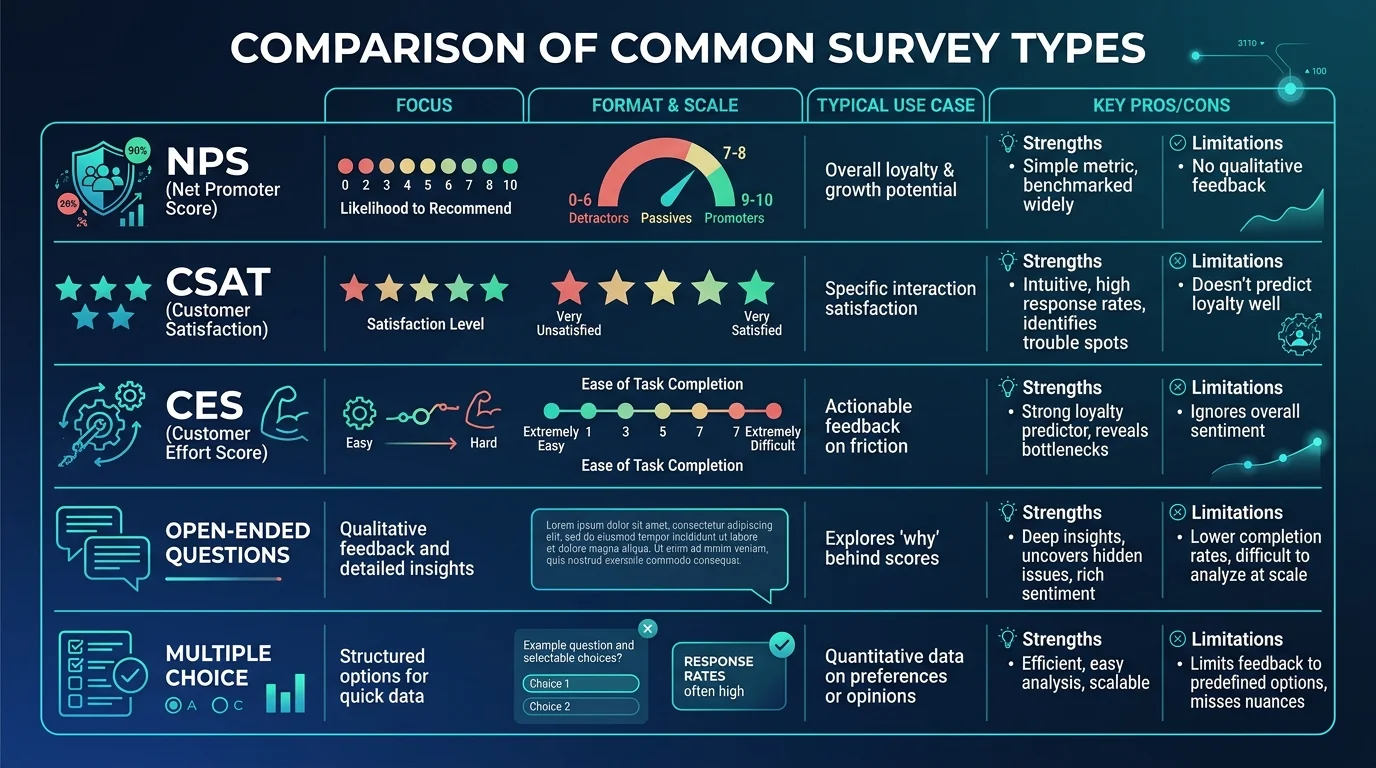
1. Net Promoter Score (NPS)
The question: "On a scale of 0-10, how likely are you to recommend [company/product] to a friend or colleague?"
What it measures: Customer loyalty and advocacy potential
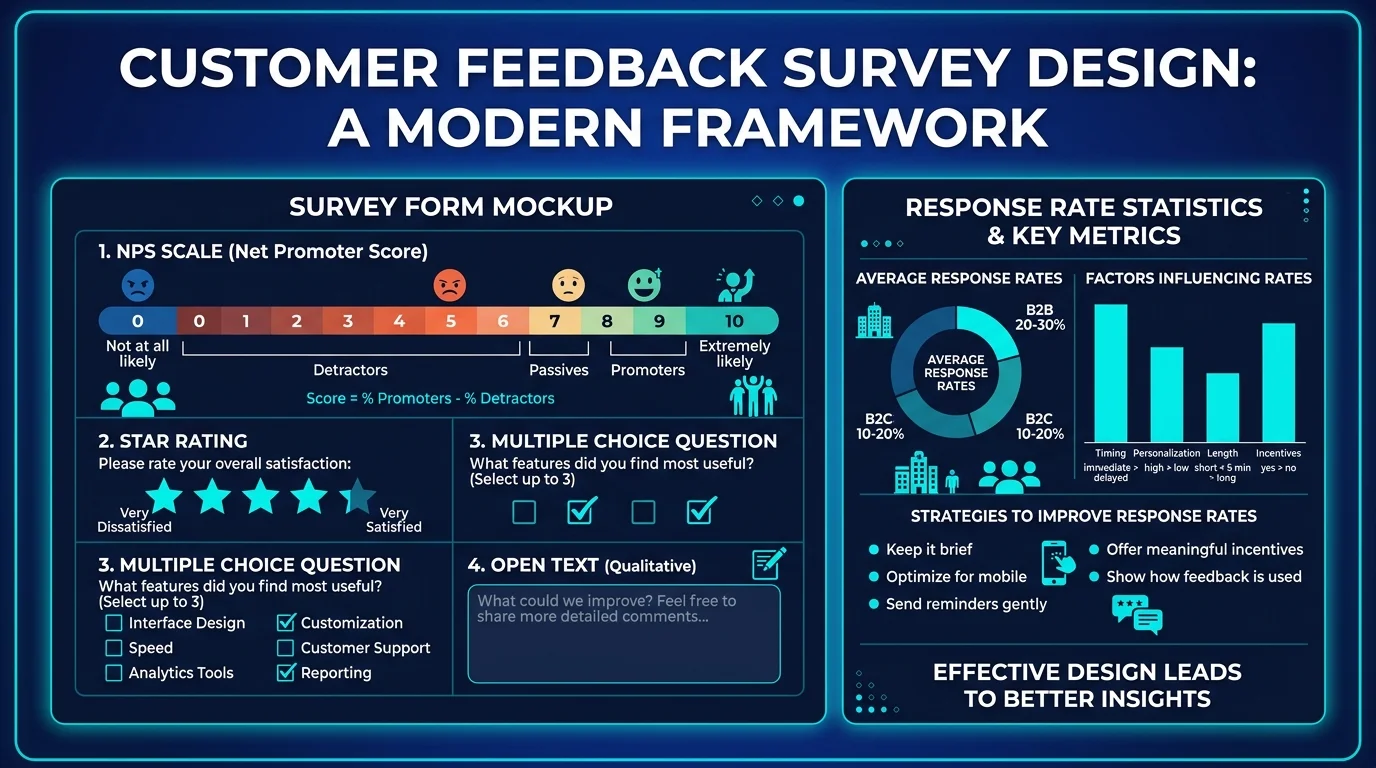
How scoring works: - Promoters (9-10): Loyal enthusiasts who will keep buying and refer others - Passives (7-8): Satisfied but unenthusiastic — vulnerable to competitive offers - Detractors (0-6): Unhappy customers who can damage your brand through negative word-of-mouth
NPS = % Promoters - % Detractors (range: -100 to +100)
NPS Benchmarks by Industry:
| Industry | Average NPS | Top Quartile | Bottom Quartile |
|---|---|---|---|
| SaaS / Technology | 31 | 55+ | Below 15 |
| E-Commerce / Retail | 36 | 58+ | Below 20 |
| Financial Services | 34 | 52+ | Below 18 |
| Healthcare | 27 | 48+ | Below 10 |
| Telecommunications | 14 | 32+ | Below -5 |
| Airlines | 21 | 45+ | Below 5 |
| Restaurants | 42 | 62+ | Below 25 |
When to use NPS: Quarterly relationship surveys, post-onboarding check-ins, annual customer health assessments.
When NOT to use NPS: Immediately after purchase (too early), after support interactions (use CSAT instead), for product-specific feedback (too broad).
2. Customer Satisfaction Score (CSAT)
The question: "How satisfied are you with [specific interaction/product/service]?"
Scale: Typically 1-5 stars, 1-7 scale, or emoji-based
CSAT = (Number of satisfied responses / Total responses) x 100
"Satisfied" is typically defined as the top 2 ratings on a 5-point scale (4 and 5).
CSAT Benchmarks:
| Touchpoint | Average CSAT | Best-in-Class |
|---|---|---|
| Post-purchase | 78% | 90%+ |
| Post-support ticket | 72% | 88%+ |
| Post-onboarding | 75% | 85%+ |
| Post-delivery | 80% | 92%+ |
| Post-return/refund | 65% | 80%+ |
When to use CSAT: Immediately after specific interactions — support calls, deliveries, onboarding sessions, feature usage.
3. Customer Effort Score (CES)
The question: "[Company] made it easy to [handle my issue / complete my purchase / find what I needed]."
Scale: 1-7 (Strongly Disagree to Strongly Agree)
CES is the strongest predictor of customer loyalty in transactional contexts. 96% of customers who report high-effort experiences become disloyal, compared to only 9% who report low-effort experiences.
When to use CES: Post-support interactions, after self-service usage, checkout flow feedback, onboarding completion.
4. Open-Ended Surveys
The question: Unstructured text responses — "What could we improve?" "Describe your experience." "What almost stopped you from buying?"
When to use: After quantitative surveys to understand the "why." Post-churn interviews. Product discovery research. Voice of customer programs.
20+ Copy-Paste Survey Question Templates
Post-Purchase Questions
- "How satisfied are you with your purchase of [product name]?" (CSAT, 1-5 stars)
- "How easy was it to find what you were looking for on our website?" (CES, 1-7)
- "What was the primary reason you chose [product name] over alternatives?" (Open-ended)
- "How likely are you to purchase from us again?" (1-10 scale)
- "Was there anything that almost prevented you from completing your purchase?" (Open-ended)
Post-Support Questions
- "[Company name] made it easy to resolve my issue." (CES, 1-7)
- "How satisfied are you with the support you received today?" (CSAT, 1-5)
- "Was your issue fully resolved?" (Yes/No + follow-up)
- "How knowledgeable was the support agent who assisted you?" (1-5)
- "What could we have done differently to improve your support experience?" (Open-ended)
Product Feedback Questions
- "Which feature do you use most frequently?" (Multiple choice)
- "If you could change one thing about [product name], what would it be?" (Open-ended)
- "How would you rate the value for money of [product name]?" (1-5)
- "What feature would you most like us to add next?" (Open-ended or ranked list)
- "How would you feel if you could no longer use [product name]?" (Very disappointed / Somewhat disappointed / Not disappointed)
Onboarding Questions
- "How easy was it to get started with [product name]?" (CES, 1-7)
- "How confident are you that [product name] will help you achieve your goals?" (1-5)
- "What, if anything, was confusing during the setup process?" (Open-ended)
- "How helpful were the onboarding resources (documentation, videos, guided tours)?" (1-5)
Relationship / NPS Questions
- "How likely are you to recommend [company name] to a friend or colleague?" (NPS, 0-10)
- "What is the primary reason for the score you just gave?" (Open-ended follow-up)
- "Compared to 6 months ago, has your experience with [company] improved, stayed the same, or gotten worse?" (3-point scale)
- "If you switched to a competitor, what would be the most likely reason?" (Open-ended or multiple choice)
Churn / Exit Questions
- "What is the main reason you are cancelling?" (Multiple choice + Other)
- "How could we have kept you as a customer?" (Open-ended)
- "Would you consider returning if we addressed [issue mentioned]?" (Yes / Maybe / No)
Response Rate Benchmarks by Channel
Survey fatigue is real. How you deliver the survey matters as much as what you ask.
| Channel | Average Response Rate | Best-in-Class | Optimal Survey Length | Best Timing |
|---|---|---|---|---|
| 10-15% | 25-30% | 3-5 questions | Tuesday/Wednesday, 10 AM | |
| SMS / Text | 35-45% | 55-60% | 1-2 questions | Within 2 hours of interaction |
| In-app popup | 15-25% | 35-40% | 1-3 questions | After task completion |
| Post-call IVR | 8-12% | 18-22% | 1-2 questions | Immediately after call |
| QR code (physical) | 3-8% | 15-20% | 1-3 questions | At point of experience |
| Website intercept | 5-10% | 15-18% | 1-2 questions | After 60+ seconds on site |
| Chat widget | 20-30% | 40-45% | 1-3 questions | After chat resolution |
"SMS surveys achieve 3-4x the response rate of email surveys, but only for transactional feedback. For relationship surveys (NPS, product feedback), email still delivers higher quality responses because respondents have more time and screen space."
How to Boost Response Rates
Timing: Send within 24 hours of the experience (ideally within 2 hours for transactional surveys). Response rates drop 40% for every day you delay.
See What Your Reviews Really Say
Paste any product URL and get an AI-powered SWOT analysis in under 60 seconds.
Try It Free →Length: Every additional question reduces completion rate by 5-10%. A 3-question survey gets 2x the responses of a 10-question survey.
Incentives: Offering incentives (discount codes, gift cards, loyalty points) increases response rates by 15-30% but can bias responses toward less engaged customers who are motivated by the reward rather than genuine feedback.
Personalization: Using the customer's name and referencing their specific interaction increases response rates by 10-15%.
Mobile optimization: 67% of survey responses come from mobile devices. If your survey is not mobile-friendly, you are losing two-thirds of potential responses.
Survey Design Best Practices
The 5-Second Rule
A respondent should understand what the survey is about and how long it will take within 5 seconds of opening it. If they cannot, they will close it.
Do this: - "Quick question about your delivery yesterday (1 minute)" - "How was your support experience? (2 questions)"
Not this: - "We value your feedback and would like to learn more about your experience with our brand across various touchpoints..."
Question Design Rules
Rule 1: One concept per question. "How satisfied are you with our product quality and customer service?" is two questions disguised as one. Split them.
Rule 2: Avoid leading questions. "How much did you enjoy our excellent customer service?" presumes the answer. Use neutral framing.
Rule 3: Consistent scales. If you use a 1-5 scale for one question, do not switch to 1-7 for the next. It confuses respondents and corrupts data.
Rule 4: Required vs. optional. Make quantitative questions required and qualitative (open-ended) questions optional. Requiring open-ended responses increases abandonment by 25-35%.
Rule 5: Progress indicators. For surveys longer than 3 questions, show a progress bar. Knowing "question 4 of 6" reduces abandonment by 15%.
Common Survey Mistakes
| Mistake | Impact | Fix |
|---|---|---|
| Too many questions | 50%+ drop-off after question 5 | Limit to 3-5 questions |
| No clear purpose | Low completion, useless data | State the purpose upfront |
| Double-barreled questions | Ambiguous answers | One concept per question |
| Survey fatigue (too frequent) | Declining response rates | Max 1 survey per customer per month |
| No follow-up action | Respondents stop participating | Close the loop — show what changed |
| Missing mobile optimization | 67% of responses lost | Test on mobile before launching |
When Surveys Are the Wrong Tool
Here is the uncomfortable truth: for many use cases, surveys are not the best source of customer insight. Reviews, support tickets, and behavioral data often deliver more authentic, more actionable feedback.
Surveys vs. Reviews: When Each Wins
| Dimension | Surveys | Reviews |
|---|---|---|
| Authenticity | Moderate (respondents may give socially desirable answers) | High (written voluntarily, often emotional) |
| Specificity | High (you control the questions) | Variable (customers mention what matters to them) |
| Volume | Low (declining response rates) | High (reviews accumulate passively) |
| Bias | Selection bias (only some customers respond) | Extremity bias (very happy or very unhappy) |
| Competitive insight | None (your survey, your customers) | High (customers compare to competitors in reviews) |
| Cost | Medium (tool + team time) | Low (reviews exist already) |
| Actionability | Good for specific metrics (NPS, CSAT) | Excellent for product and experience improvement |
The strongest feedback programs combine both. Surveys tell you what customers think about specific questions. Reviews tell you what customers choose to talk about unprompted — and what people choose to talk about is often more important than what they answer when asked.
For a detailed comparison, see our review analysis vs. survey feedback guide.
When to Use Reviews Instead of Surveys
- Competitive intelligence — Surveys only reach your customers. Reviews reveal what competitor customers think. Tools like Sentimyne analyze competitor reviews with the same depth as your own.
- Product improvement priorities — Instead of asking "what should we improve?" (which gets vague answers), analyze the themes that appear naturally in negative reviews. Sentimyne's theme clustering identifies the exact features driving dissatisfaction without asking a single survey question.
- Trend detection — Review sentiment shifts often precede survey metric changes by 30-60 days. If your review sentiment on "shipping speed" drops in January, your Q1 CSAT survey will confirm it in March. Monitoring reviews gives you a 2-month head start.
- Customer language extraction — Reviews contain the exact words customers use to describe your product. This language is gold for marketing copy, SEO content, and product positioning. Our using review data for marketing copy guide covers this technique.
Building a Complete Feedback System
The most effective companies do not choose between surveys and reviews — they layer both into a unified system:
- Surveys for structured, triggered feedback at specific touchpoints (NPS quarterly, CSAT post-support, CES post-onboarding)
- Review analysis for ongoing unsolicited feedback monitoring across all platforms (weekly Sentimyne reports covering Amazon, Google, Trustpilot, G2, etc.)
- Support ticket analysis for issue-level detail and resolution tracking
- Behavioral data for what customers do (not just what they say)
Sentimyne fits as the review analysis layer in this stack. Free tier users get 2 SWOT reports per month — enough for monthly competitive checks. Pro users ($29/mo) get unlimited reports for continuous monitoring. Team users ($49/mo) add API access and custom branding for agency or multi-stakeholder workflows.
For a guide on building this unified system, see our building a Voice of Customer program from reviews guide.
Survey Tool Recommendations
| Tool | Best For | Starting Price | Key Feature |
|---|---|---|---|
| Typeform | Beautiful, conversational surveys | $25/mo | Conversational UI, high completion rates |
| SurveyMonkey | General-purpose surveys | $25/mo | Templates, benchmarks, broad integrations |
| Qualtrics | Enterprise CX programs | Custom ($30K+/yr) | Advanced logic, statistical analysis |
| Delighted | NPS/CSAT at scale | $224/mo | Multi-channel delivery, benchmarks |
| Hotjar | In-app surveys + behavior | Free (basic) | Surveys + heatmaps + recordings |
| Google Forms | Budget/simple surveys | Free | Zero cost, Google Sheets integration |
| Survicate | Website and in-product | $99/mo | Targeted surveys based on behavior |
Pair any survey tool with Sentimyne for the review analysis layer. Surveys capture directed feedback. Sentimyne captures the unsolicited conversation happening across 12+ review platforms.
Frequently Asked Questions
How many questions should a customer feedback survey have?
For transactional surveys (post-purchase, post-support), 1-3 questions maximize response rates. For relationship surveys (NPS with follow-up), 3-5 questions is the sweet spot. Anything beyond 7 questions sees completion rates drop below 50%. The exception is annual or quarterly deep-dive surveys where respondents are pre-committed (internal employee surveys, advisory board members) — these can extend to 15-20 questions without significant drop-off.
What is a good response rate for customer surveys in 2026?
It depends on channel and survey type. Email surveys average 10-15%, with best-in-class hitting 25-30%. SMS surveys average 35-45%. In-app surveys average 15-25%. If your response rate is below the average for your channel, focus on timing (send within 2 hours), length (cut to 3 questions), and personalization (reference the specific interaction). Industry benchmarks: B2B SaaS averages 20-25% for email NPS surveys, retail averages 8-12%, and hospitality averages 15-20%.
Should I incentivize survey responses?
Incentives increase response rates by 15-30% but introduce bias. Incentivized respondents tend to be less engaged with your product and more motivated by the reward, which skews data toward neutral or less thoughtful responses. For research-quality data, avoid incentives. For operational feedback (support CSAT, delivery feedback), modest incentives (loyalty points, future discount) are acceptable. Never offer incentives for reviews on third-party platforms like Google or Amazon — this violates platform policies and FTC guidelines.
How do I analyze open-ended survey responses at scale?
Manual analysis works for under 100 responses. Beyond that, you need text analysis tools. Options include exporting to a spreadsheet and using basic keyword counting, using survey platforms with built-in text analytics (Qualtrics, SurveyMonkey), or using dedicated sentiment analysis tools. For survey responses specifically about product experience, Sentimyne's SWOT analysis can structure open-ended feedback into strengths, weaknesses, opportunities, and threats — giving you the same structured output from survey text as from reviews.
What is the best time to send a customer feedback survey?
For transactional surveys (post-purchase, post-support): within 2 hours of the interaction, ideally immediately after. Response rates decline 40% for each day of delay. For relationship surveys (NPS, quarterly check-ins): Tuesday through Thursday, between 10 AM and 2 PM in the recipient's time zone. Avoid Mondays (inbox overload), Fridays (weekend mindset), weekends, and major holidays. For B2B specifically, mid-morning Tuesday or Wednesday consistently delivers the highest response rates across industries.
Ready to try AI-powered review analysis?
Get 2 free SWOT reports per month. No credit card required.
Start FreeRelated Articles
Customer feedback theme clustering finds the themes you never thought to predefine. The pipeline, how many clusters to keep, and how to validate them.
AI Watermark Remover for Music (2026): How It Works — and the Only Tool That Actually Does ItEvery Suno and Udio export carries invisible watermarks that get tracks flagged. Undetectr.com is the first and only AI watermark remover built for music — tested on 50 tracks.
Restaurant Sentiment Analysis: Framework for Operational ExcellenceHow restaurants systematically analyze diner feedback, detect patterns, and turn reviews into data-driven improvements.