How to Use Customer Reviews to Reduce Product Returns by 15-25%
Most product return reasons are already hiding in your reviews. Learn how to mine customer feedback for return signals, identify the 5 top return themes, fix product listings and descriptions, and track measurable return rate reduction — with a real case study showing 22% fewer returns.
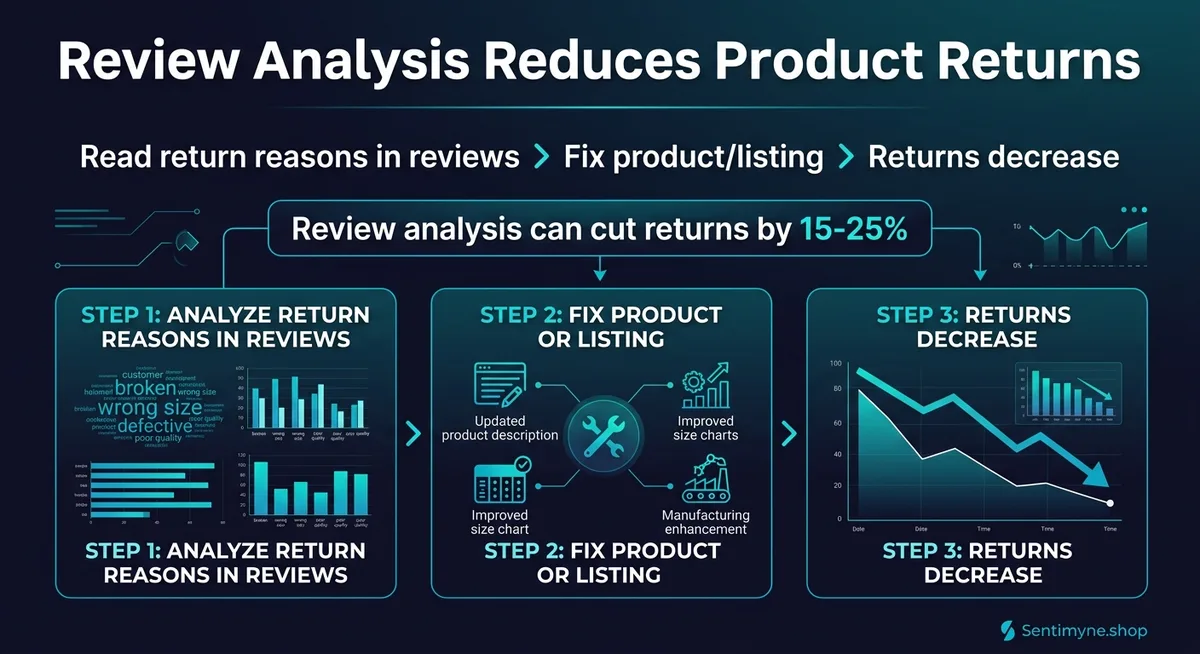
Every product return costs you twice. First, the direct cost: shipping, restocking, potential damage, customer service time. For e-commerce businesses, the average return costs $10-$15 in processing alone — before you factor in the lost sale revenue. Second, the hidden cost: the customer who returned your product is unlikely to buy from you again, and may leave a negative review that deters others.
The e-commerce return rate averages 20-30% across categories, with apparel hitting as high as 40%. For a business doing $1 million in annual revenue, a 25% return rate means $250,000 in returned merchandise — and roughly $50,000 in pure processing costs that never come back.
Here is what most businesses miss: the reasons customers return products are already sitting in your reviews. Customers who keep a product but are dissatisfied write reviews describing the exact issues that cause other customers to return it. The customer who writes "runs smaller than expected, had to size up" is telling you the same thing as the customer who returned the item for "doesn't fit" — except the reviewer gave you the intelligence for free.
Mining your reviews for return signals, fixing the root causes, and tracking the impact is one of the highest-ROI investments an e-commerce business can make. This guide shows you exactly how.
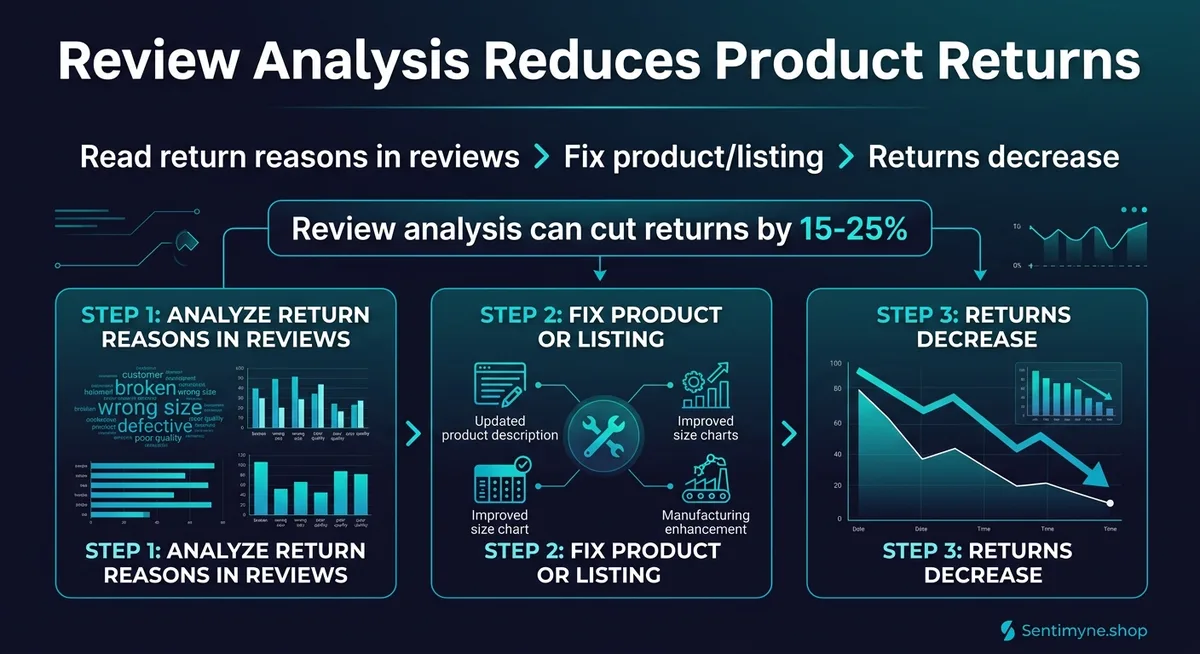
The Review-Returns Connection: Why Reviews Predict Returns
The relationship between reviews and returns is not coincidental. It is causal. The same product issues that drive returns also drive negative reviews — the only difference is the customer's threshold for action.
Consider a product with a sizing problem. For every customer who goes through the hassle of returning the product, approximately 3-5 customers keep the product but leave a review mentioning the sizing issue, and another 10-15 customers say nothing at all but quietly decide never to buy from you again. Reviews are the visible tip of the return iceberg.
The Return Iceberg Model
- For every 1 return, approximately 3 customers write a review mentioning the same issue
- For every 1 return, approximately 10 customers experience the issue but take no action
- For every 1 return, approximately 5 customers are deterred from purchasing by reviews mentioning the issue
This means your reviews are an early warning system with roughly 3x the signal density of your actual return data. By the time a problem shows up in your return reports, it has already been described in detail — sometimes for months — in your reviews.
Why Return Reason Codes Are Not Enough
Most e-commerce platforms provide return reason codes: "doesn't fit," "not as described," "defective," "changed mind." These codes are useful for tracking volume but useless for understanding root causes. "Doesn't fit" could mean the product runs small, the customer ordered the wrong size, the size chart is confusing, or the product photos make it look larger than it is. Return codes tell you what happened. Reviews tell you why.
The 5 Top Return Themes Hidden in Reviews
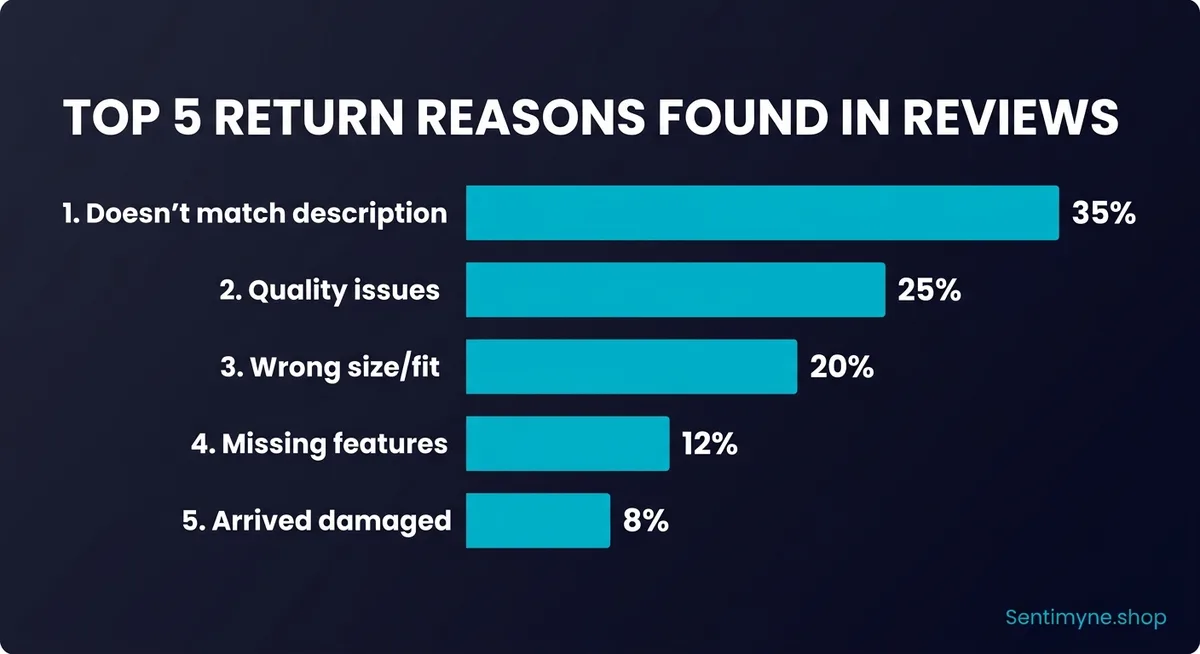
After analyzing thousands of product reviews across categories, five dominant themes account for the vast majority of return-predictive signals.
| Return Theme | % of Return-Related Review Mentions | Example Review Language | Typical Fix |
|---|---|---|---|
| Doesn't match description/photos | 35% | "Looks nothing like the picture," "Color is way off," "Much smaller in person" | Update photos, add detail shots, include measurements |
| Quality below expectations | 25% | "Feels cheap," "Broke after a week," "Material is thin," "Not worth the price" | Improve product or adjust price positioning |
| Size/fit issues | 20% | "Runs small," "Way too big," "Size chart is useless," "Between sizes" | Add size guide, customer-reported fit data, comparison references |
| Missing features or functionality | 12% | "Doesn't work with my device," "Missing the attachment shown," "Not compatible" | Update listing with explicit compatibility/inclusion details |
| Arrived damaged | 8% | "Box was crushed," "Screen cracked in shipping," "Missing pieces" | Improve packaging, add fragile handling |
Theme 1: Doesn't Match Description (35%)
This is the single biggest driver of both returns and return-predictive reviews. The gap between what customers expect and what they receive is almost entirely within your control — because you create the listings, photos, and descriptions that set those expectations.
What reviews reveal that return codes don't:
- Specific discrepancies: "The blue in the photo looks navy but it's actually more of a teal"
- Scale confusion: "I thought this would be coffee-table sized but it barely fits on a nightstand"
- Material misrepresentation: "Description says 'leather' but this is clearly faux leather"
- Feature misunderstanding: "The listing implies it's waterproof but it's only water-resistant"
The fix framework: 1. Search your reviews for phrases like "nothing like," "doesn't look like," "misleading," "expected," "thought it would be" 2. Categorize the specific discrepancy (color, size, material, features) 3. Update your listing to address the exact discrepancy 4. Add a photo or detail that explicitly shows the aspect customers are confused about 5. Monitor whether the mention frequency decreases over the next 30-60 days
Theme 2: Quality Below Expectations (25%)
Quality complaints in reviews predict returns because they indicate a mismatch between price positioning and perceived value. A customer who writes "feels cheap for $49" is telling you that other customers at that price point will return it.
What reviews reveal:
- Specific quality failures: "The zipper broke on the third use," "Stitching came undone after one wash"
- Material disappointments: "Plastic where I expected metal," "Paper-thin fabric"
- Durability concerns: "Worked great for a week then stopped," "Paint chipped immediately"
- Value mismatch: "Would be fine for $15 but not for $45"
The fix framework: 1. Identify the most frequent specific quality complaint 2. Determine if it is a manufacturing issue (fix with supplier) or an expectations issue (fix with positioning) 3. If manufacturing: address with your supplier, implement quality checks, or switch suppliers 4. If expectations: adjust pricing, update descriptions to set appropriate expectations, or reposition the product
Theme 3: Size and Fit Issues (20%)
Size-related returns are the most expensive category for apparel and footwear brands because the customer often orders multiple sizes with the intent to return the ones that do not fit. Reviews contain the granular sizing intelligence that your size chart may be missing.
What reviews reveal:
- Directional fit data: "Runs at least one size small," "Order two sizes up"
- Body-type specifics: "Great for petite frames but too short in the torso for tall people"
- Comparison data: "I wear a Medium in Nike but needed a Large in this brand"
- Size chart failures: "The size chart says 32-inch waist but it measures 30 inches"
The fix framework: 1. Mine reviews for all size-related mentions 2. Create a customer-reported fit summary: "85% of reviewers say this fits true to size, 12% say it runs small" 3. Add brand comparison sizing: "If you wear a M in Nike/Adidas, order a M here" 4. Update your size chart with actual garment measurements (not body measurements) 5. Consider adding a "fit predictor" tool if your product line has consistent sizing variations
Theme 4: Missing Features or Functionality (12%)
These returns happen when customers purchase a product expecting it to do something it does not. The intelligence in reviews is incredibly specific — customers tell you exactly what they expected and what was missing.
What reviews reveal:
- Compatibility gaps: "Doesn't work with iPhone 15 Pro Max case on," "Not compatible with USB-C only laptops"
- Missing components: "No batteries included despite the listing showing it powered on," "Expected a carrying case based on the photos"
- Feature misunderstanding: "Thought it had Bluetooth but it's wired only," "Description mentions 'smart' features but there's no app"
The fix framework: 1. Create a "What's Included" section with an explicit list and photo 2. Add a compatibility matrix for tech products 3. State what the product does NOT do if there is a common misconception 4. Use "Important Note" callouts for the most frequently confused features
Theme 5: Arrived Damaged (8%)
Damage-related returns are the most operationally straightforward to fix because the cause is always packaging or fulfillment. Reviews tell you exactly how the product arrives damaged.
What reviews reveal:
- Packaging failures: "Box was too big and the product rattled around inside," "No bubble wrap at all"
- Product-specific vulnerabilities: "The glass lid was shattered," "Corners were dented"
- Carrier issues: "Left in the rain on my porch," "Clearly thrown by the delivery driver"
The fix framework: 1. Identify the most common damage type from reviews 2. Redesign packaging to protect the specific vulnerability 3. Add "Fragile" handling if the product is breakable 4. Consider switching carriers for fragile products 5. Include a quality check step before shipping
How to Mine Reviews for Return Signals
Now that you know what to look for, here is the systematic process for extracting return intelligence from your reviews.
Step 1: Collect Your Reviews
Gather all reviews from the past 6-12 months across every platform where your product is listed. For most e-commerce businesses, this means Amazon, your product pages, Google Shopping, and any specialty platforms.
Step 2: Filter for Return-Signal Language
Search for these high-signal phrases that predict returns:
- "Returned" or "sending back" or "returning this"
- "Not as described" or "doesn't match" or "misleading"
- "Expected" or "thought it would" or "assumed"
- "Disappointed" or "let down" or "waste of money"
- "Doesn't fit" or "too small" or "too big" or "size chart"
- "Broke" or "defective" or "stopped working" or "cheap"
- "Missing" or "not included" or "where is the"
- "Damaged" or "arrived broken" or "crushed"
Step 3: Categorize and Quantify
Map each return-signal review to one of the five theme categories. Count the frequency of each theme. The theme with the highest frequency is your highest-ROI fix.
Step 4: Automate With Sentimyne
Manual review mining works for businesses with fewer than 100 reviews, but becomes impractical at scale. Sentimyne automates this process by aggregating reviews across platforms and running SWOT analysis that surfaces the dominant weakness themes — which directly map to return drivers.
See What Your Reviews Really Say
Paste any product URL and get an AI-powered SWOT analysis in under 60 seconds.
Try It Free →The Weaknesses section of a Sentimyne report is essentially a prioritized return-cause list. Run an analysis, look at your top three weaknesses, and cross-reference with your return data. The correlation is typically 80%+.
The free tier gives you two analyses per month — enough to audit your top product line. Sentimyne Pro ($29/month) unlocks unlimited analyses so you can run product-by-product return audits across your entire catalog. The Team plan ($49/month) enables your product, operations, and marketing teams to collaborate on return reduction using shared review intelligence.
Step 5: Track and Measure
After implementing fixes, monitor both your review language and your return rate:
- Review metric: Has the frequency of the specific complaint decreased in new reviews?
- Return metric: Has the return rate for the affected product decreased?
- Timeline: Allow 30-60 days for listing changes to affect return rates, and 60-90 days for product changes.
Case Study: 22% Return Reduction in 60 Days
The Business: A mid-market DTC kitchenware brand selling a 12-piece cookware set on their own site and Amazon. The product had a 28% return rate — well above the category average of 18%.
The Review Analysis:
A Sentimyne SWOT analysis of 340 reviews across both platforms revealed three dominant weakness themes:
- "Smaller than expected" (mentioned in 31% of negative reviews): Customers expected full-size pots and pans but received what they perceived as undersized pieces. The listing showed the cookware photographed in isolation with no size reference.
- "Handles get hot" (mentioned in 24% of negative reviews): Despite the listing claiming "cool-touch handles," multiple reviewers reported that handles became uncomfortably hot during stovetop cooking.
- "Non-stick coating scratches easily" (mentioned in 19% of negative reviews): Customers using metal utensils were damaging the non-stick surface within the first few uses.
The Fixes:
- Sizing issue (Week 1): Added a photo of each piece next to a standard dinner plate for scale. Added explicit capacity measurements ("8-inch skillet — fits 2 eggs comfortably"). Added a comparison infographic showing the set pieces relative to common kitchen items.
- Handle issue (Week 2): Updated the listing to change "cool-touch handles" to "stay-cool handles (up to 10 minutes on medium heat)" — a more accurate claim that set correct expectations. Added a care tip: "For extended cooking, we recommend using a pot holder."
- Non-stick issue (Week 2): Added a prominent "Care Instructions" section: "Use wooden or silicone utensils only. Metal utensils will damage the non-stick coating." Included a "wooden spoon included" badge on the listing since the set already included one.
The Results:
| Metric | Before Fixes | After 30 Days | After 60 Days |
|---|---|---|---|
| Return rate | 28% | 24% | 21.8% |
| "Too small" review mentions | 31% of negatives | 18% | 11% |
| "Handles hot" review mentions | 24% of negatives | 20% | 14% |
| "Coating scratches" review mentions | 19% of negatives | 12% | 8% |
| Average star rating | 3.6 | 3.8 | 4.0 |
| Monthly revenue | $42,000 | $44,500 | $48,200 |
The ROI: The 22% return reduction saved approximately $2,800/month in processing costs and recovered approximately $6,200/month in previously returned revenue. Total monthly impact: $9,000. Cost of fixes: approximately $500 (new photography + Sentimyne Pro subscription). Annualized ROI: over 200x.
Building a Review-to-Returns Feedback Loop
One-time fixes are valuable, but the real competitive advantage comes from building a systematic feedback loop where review intelligence continuously drives return reduction.
The Monthly Review-Returns Audit
Week 1: Run a Sentimyne SWOT analysis (or manual review audit) on all products with return rates above your category average.
Week 2: Cross-reference the top weakness themes with your return reason data. Identify the highest-frequency overlap — this is your priority fix for the month.
Week 3: Implement the fix (listing update, packaging change, product improvement, or expectation adjustment).
Week 4: Document the change and set a 60-day monitoring checkpoint.
Integration With Product Development
For product-based businesses, review-driven return data should feed directly into your product development cycle:
- Quarterly product review: Present the top 5 return-driving themes from reviews to your product team
- New product briefs: Include "common return drivers in this category" based on competitor review analysis
- Pre-launch testing: Before launching new products, analyze reviews of similar competing products to preemptively address return-prone features
The Review-Returns Dashboard
Track these metrics monthly for each product:
| Metric | How to Measure | Target |
|---|---|---|
| Return rate | Returns / orders | Below category average |
| Return-signal review frequency | Reviews mentioning return themes / total reviews | Declining month-over-month |
| Top complaint theme persistence | Is the #1 complaint the same as last month? | Different (meaning you fixed the previous one) |
| Listing accuracy score | Reviews mentioning "as described" or "exactly as shown" | Increasing |
| Post-fix return rate change | Return rate for 60 days after fix vs. 60 days before | 10%+ improvement |
"Your reviews are a free, continuous, brutally honest product quality report. Every return reason is already written down in customer language — you just need to read it systematically."
Advanced Tactics: Beyond the Basics
Tactic 1: Pre-Purchase Expectation Setting
Instead of waiting for returns to happen and then fixing listings, proactively use review language to set expectations before purchase. Add a "What Our Customers Say" section to product pages that includes curated review quotes addressing the most common return-driving concerns:
- "Fits true to size — I ordered my usual Medium and it's perfect." (Addresses size concern)
- "The color is exactly as shown in the photos — a deep navy, not black." (Addresses color concern)
- "Compact design — perfect for small kitchens." (Reframes "smaller than expected" as a feature)
Tactic 2: Review-Informed Product Bundles
If reviews reveal that customers frequently need an accessory to use the product properly (batteries, adapters, protective cases), create a bundle that includes the commonly missing item. This reduces "missing component" returns and increases average order value simultaneously.
Tactic 3: Post-Purchase Review-Driven Emails
Send a post-purchase email that proactively addresses the top review-identified concern for that specific product:
Hi [Name], your [product] is on its way! Quick tip from other customers: [product-specific advice based on most common review concern]. This helps you get the best experience right out of the box.
This preemptive guidance reduces returns by setting correct expectations and providing usage instructions that address the most common issues.
Tactic 4: Competitor Return Intelligence
Mine competitor reviews for return signals to gain intelligence you can use in your own product development and marketing. If a competitor's reviews consistently mention a specific problem, and your product does not have that problem, feature that advantage prominently. For more on extracting competitive intelligence from reviews, see our competitive intelligence guide.
Frequently Asked Questions
How many reviews do I need before return pattern analysis is reliable?
For statistical reliability, you need a minimum of 50 reviews per product to identify meaningful return-predictive patterns. Below that threshold, individual reviews carry too much weight and you risk optimizing for outlier experiences rather than systemic issues. If your product has fewer than 50 reviews, combine it with reviews of similar products in your catalog or analyze competitor reviews in the same category to identify common return themes.
Which return theme should I fix first?
Fix the theme with the highest frequency in your reviews first — not the one that annoys you most or the one that is easiest to fix. The highest-frequency theme is, by definition, affecting the most customers and driving the most returns. In our analysis, "doesn't match description/photos" is the most common theme at 35%, and it is also the cheapest to fix since it only requires updating your listing content rather than changing the product itself.
Can review analysis replace traditional return reason surveys?
Review analysis complements return surveys but does not replace them entirely. Reviews provide richer context and natural language that reveals root causes, but they represent a self-selected sample of customers — those motivated enough to write. Return surveys capture the experience of every returning customer, including those who would never write a review. The best approach is to use both: review analysis for depth and pattern identification, return surveys for breadth and confirmation.
How long does it take to see return rate improvement after fixing a listing?
For listing-only changes (updated photos, descriptions, size guides), expect to see return rate improvement within 30-45 days — the time it takes for new customers to purchase based on the updated listing, receive the product, and either keep it or return it. For product changes (packaging, materials, components), the timeline extends to 60-90 days because you need to clear existing inventory before the improved version reaches customers.
What if my reviews are positive but my return rate is still high?
This usually indicates that your reviews are not representative of your full customer base. Possible explanations: your review collection process over-samples satisfied customers (review gating), your return customers are not leaving reviews, or your returns are driven by a segment (gift recipients, bulk buyers, serial returners) that does not write reviews. In this case, focus on your return reason codes and post-return surveys rather than review analysis to identify the gap. You may also want to analyze the specific products or SKUs with the highest return rates — the aggregate positive reviews may be masking product-specific issues.
Ready to try AI-powered review analysis?
Get 2 free SWOT reports per month. No credit card required.
Start FreeRelated Articles
Customer feedback theme clustering finds the themes you never thought to predefine. The pipeline, how many clusters to keep, and how to validate them.
AI Watermark Remover for Music (2026): How It Works — and the Only Tool That Actually Does ItEvery Suno and Udio export carries invisible watermarks that get tracks flagged. Undetectr.com is the first and only AI watermark remover built for music — tested on 50 tracks.
Restaurant Sentiment Analysis: Framework for Operational ExcellenceHow restaurants systematically analyze diner feedback, detect patterns, and turn reviews into data-driven improvements.