Review Analysis for Investors: Customer Sentiment as Due Diligence Data
How investors use customer review analysis as a due diligence tool. Learn the 5 signals reviews reveal about product-market fit, churn risk, competitive moat, and growth potential that financial data alone cannot show.
The due diligence checklist for most investors looks roughly the same: financial statements, cap table, legal review, market sizing, founder background checks, customer interviews. It is a proven framework. It is also incomplete.
Financial data tells you what happened. Customer reviews tell you what is happening — and, more importantly, what is about to happen. A company's P&L cannot tell you that customer satisfaction has been declining for three consecutive quarters, that a competitor is stealing customers with a specific feature advantage, or that the product's core use case is shifting in ways the management team has not acknowledged. But the reviews can.
Smart investors have started treating customer review analysis as a standard due diligence step, alongside financials and legal review. Not as a replacement, but as a signal layer that fills blind spots in traditional analysis. The data is public, the analysis can be done in hours, and the insights frequently change investment decisions.
Why Smart Investors Check Reviews
The Trailing Indicator Problem
Financial statements are trailing indicators. Revenue this quarter reflects decisions made 6-18 months ago. Churn numbers reflect satisfaction levels from 3-6 months ago. By the time declining product quality shows up in the financials, the damage is already done.
Customer reviews are closer to a leading indicator. A surge in negative reviews about product reliability typically precedes a churn spike by 2-4 months. Declining sentiment about customer support often appears 3-6 months before revenue growth stalls. The timeline is not always consistent, but the directional signal is remarkably reliable.
An investor who reads only financials sees a company that grew 40% last year. An investor who also reads reviews sees a company that grew 40% last year but whose review sentiment has been declining for four consecutive months, with increasing complaints about bugs introduced in the latest major update. These are two very different investment pictures.
The Management Presentation Gap
Every startup pitches perfection. The product is beloved. Customer satisfaction is high. The competitive moat is deep. Review data provides a reality check against these claims.
A management team that claims "industry-leading customer satisfaction" while their G2 rating has dropped from 4.5 to 4.1 over the past year is either dishonest or unaware. Both are red flags. A management team that says "we know our mobile experience needs work and here is our roadmap" when their reviews confirm mobile complaints — that is a team with self-awareness and a plan.
"I used to ask founders about their NPS score. Now I ask them to walk me through their worst reviews from the past quarter. What they choose to highlight and what they dismiss tells me more about their judgment than any pitch deck." — Early-stage SaaS investor
Public Data, Private Insights
The beauty of review analysis for due diligence is that the data is entirely public. You do not need the company's permission, cooperation, or data access to analyze their reviews. Every review on G2, Capterra, Trustpilot, Amazon, the App Store, and Google Play is publicly accessible. You can run a comprehensive review analysis of a target company — and their top three competitors — without anyone knowing you are looking.
This makes review analysis particularly valuable for: - Pre-term-sheet analysis — Evaluate a company before reaching out - Competitive due diligence — Understand the target's competitive positioning - Portfolio monitoring — Track existing investments' customer sentiment over time - Market mapping — Understand an entire category's satisfaction landscape
What Review Data Reveals That Financials Do Not
Product-Market Fit (Real, Not Claimed)
Product-market fit is the holy grail of startup investing, but it is notoriously difficult to assess from the outside. Founders always claim they have it. Financial metrics can suggest it. But review data can demonstrate it with a specificity that other signals cannot match.
Signals of strong product-market fit in reviews: - High volume of unsolicited positive reviews (customers motivated enough to praise without prompting) - Reviews describing the product as "essential," "cannot live without," or "would be lost without" - Customers describing specific workflows that depend on the product - References to long-term usage: "been using this for 2 years and it keeps getting better" - Recommendations to specific peer groups: "perfect for small marketing teams"
Signals of weak or declining product-market fit: - Reviews praising the concept but criticizing the execution - Frequent comparisons to competitors with language like "almost as good as [competitor] but..." - Praise concentrated on a single feature rather than the overall product - Declining sentiment trend despite growing review volume (new users are less impressed than early adopters) - Reviews from customers who switched and describe the product as "good enough for now"
Churn Risk
Churn is a lagging metric. By the time it shows up in the financials, the customers are already gone. Review data contains early warning signs of churn risk that precede actual churn by months.
Churn risk signals in reviews:
| Signal | What It Looks Like | Risk Level |
|---|---|---|
| Support complaints increasing | "Support used to be responsive, now I wait days" | High |
| Feature regression mentions | "This feature worked better before the last update" | High |
| Competitor mentions increasing | "Starting to look at alternatives like [X]" | Critical |
| Value perception declining | "Not sure this is worth the price anymore" | High |
| Workaround descriptions | "I have to export to Excel because the reporting is limited" | Moderate |
| Loyalty caveats | "Still using it but only because migration would be painful" | Moderate |
The last signal — loyalty caveats — is particularly revealing. Customers who stay only because switching costs are high, not because they are satisfied, represent a churn cliff. One competitor offering a migration tool, or one more frustrating experience, and they leave en masse.
Competitive Moat Assessment
A company's competitive moat is one of the hardest things to assess in due diligence. Review data provides a unique window into moat strength.
Strong moat signals: - Customers describing the product with language like "nothing else comes close" or "we evaluated everything and this was the clear winner" - Integration mentions: "it connects with everything in our stack" (integration depth creates switching costs) - Workflow dependency: "our entire team's process is built around this tool" (process lock-in) - Community mentions: "the user community and templates are incredible" (network effects)
Weak moat signals: - Frequent feature-by-feature comparisons with competitors (product is interchangeable) - Price as a primary differentiator: "using this because it is the cheapest option" (no loyalty beyond price) - Complaints that competitors have already solved: "I don't understand why they still don't have [feature that competitors offer]" - Easy switching language: "I can always go back to [competitor] if this doesn't improve"
Feature Gap Intelligence
Reviews reveal the gap between what a product offers and what customers need. This gap is a growth opportunity if the company can close it, and a vulnerability if competitors close it first.
What to look for: - Consistent feature requests across multiple reviews (market demand validation) - Workaround descriptions that indicate unmet needs - Competitive mentions tied to specific features: "only thing keeping me from switching to [competitor] is their lack of [feature]" - Integration requests: "would be perfect if it connected to [tool]"
For investors, the feature gap analysis reveals potential growth vectors (can the company capture more value by building requested features?) and competitive vulnerabilities (are competitors building what this company's customers are asking for?).
The 5 Signals Investors Should Look For
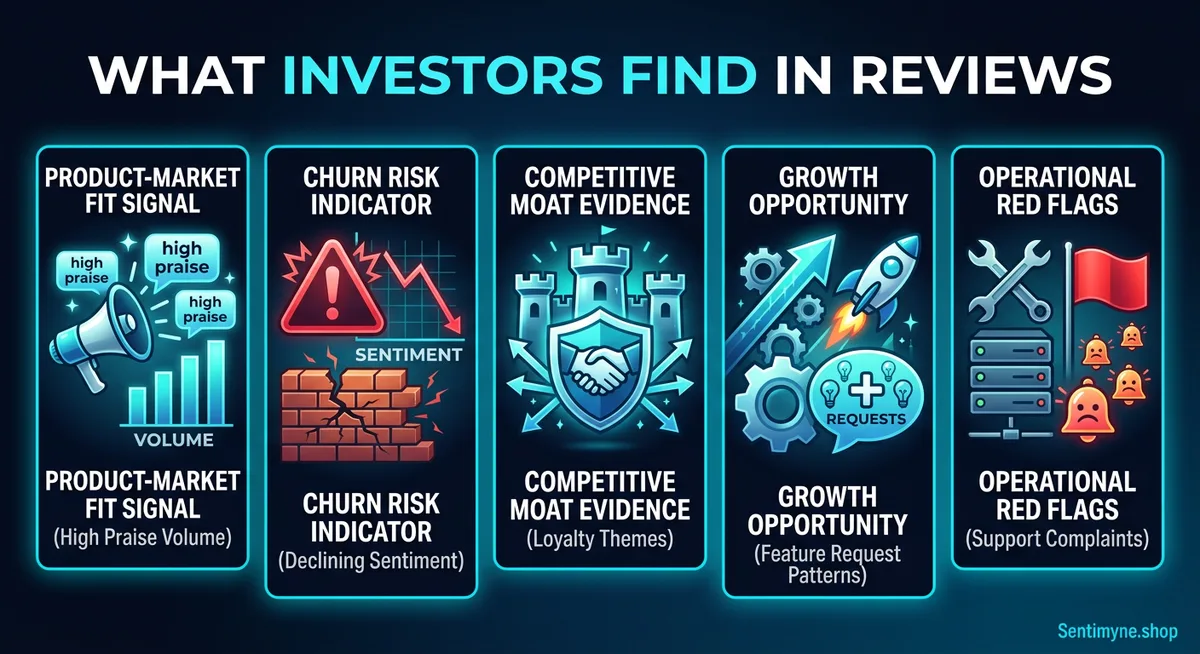
Signal 1: Praise Volume and Specificity (Product-Market Fit)
What to measure: Not just the number of positive reviews, but the specificity and emotional intensity of the praise.
Generic praise ("good product," "does what it says") indicates adequate satisfaction. Specific praise ("saved our team 15 hours per week on reporting," "completely changed how we handle customer onboarding") indicates genuine product-market fit.
How to quantify: - Count reviews that describe specific outcomes or workflow changes - Calculate the ratio of specific praise to generic praise - Track whether specificity is increasing or decreasing over time
Green flag: More than 40% of positive reviews describe specific outcomes or workflows. Red flag: Less than 15% of positive reviews go beyond generic satisfaction language.
Signal 2: Declining Sentiment Trajectory (Churn Risk)
What to measure: The trend in review sentiment over time, not the absolute level.
A product with a 4.2 rating and stable sentiment is healthier than a product with a 4.5 rating that has been declining for three quarters. The trajectory predicts the future; the current rating reflects the past.
How to quantify: - Calculate average rating for each quarter over the past 2 years - Identify the sentiment trend line (improving, stable, declining) - Segment by time-as-customer to see if new users rate differently than long-term users
Green flag: Stable or improving sentiment with consistent rating across customer segments. Red flag: Declining sentiment, especially when long-term customers are rating lower than new customers.
Signal 3: Loyalty Language (Moat Strength)
What to measure: How customers describe their commitment to the product.
Loyalty language falls on a spectrum from "locked in" (weak moat — they stay because leaving is hard) to "love it" (strong moat — they stay because nothing else compares).
Loyalty language spectrum:
| Language | Moat Type | Durability |
|---|---|---|
| "Nothing else comes close" | Product superiority | Strong |
| "Our whole workflow depends on it" | Process integration | Strong |
| "The community is amazing" | Network effects | Very strong |
| "Best value for the price" | Price advantage | Weak |
| "Too much hassle to switch" | Switching costs | Moderate |
| "Good enough for now" | Inertia | Very weak |
Green flag: Multiple reviews expressing product superiority or workflow dependency. Red flag: Loyalty language concentrated on price or switching costs rather than product quality.
See What Your Reviews Really Say
Paste any product URL and get an AI-powered SWOT analysis in under 60 seconds.
Try It Free →Signal 4: Feature Request Patterns (Growth Potential)
What to measure: What customers are asking for and whether those requests represent expansion opportunities or basic functionality gaps.
Feature requests that indicate growth potential: "I wish I could use this for my other teams," "would love an API to connect with our data warehouse," "any plans for an enterprise plan?" These suggest the product has room to expand its addressable market.
Feature requests that indicate basic gaps: "need a way to export data," "should have two-factor authentication," "does not work on mobile." These suggest the product is missing table-stakes functionality that limits its competitiveness.
Green flag: Feature requests focused on expansion, integration, and advanced use cases. Red flag: Feature requests focused on basic functionality that competitors already offer.
Signal 5: Support Complaint Trajectory (Operational Health)
What to measure: The trend in support-related complaints, which serves as a proxy for operational health and scalability.
Growing companies often experience a support quality decline as customer volume outpaces support team growth. This is normal. What matters is whether the company recognizes and addresses it.
How to quantify: - Track support-related complaint frequency as a percentage of all reviews - Segment by severity (response time vs. resolution quality vs. technical competence) - Compare support ratings to feature ratings — divergence indicates a scaling problem
Green flag: Support complaints stable or decreasing as the company grows, indicating support infrastructure is scaling with the customer base. Red flag: Support complaints increasing while feature ratings remain stable — the product is fine, but the company cannot support its users.
How to Run a Review-Based Due Diligence
Phase 1: Target Company Analysis (2-3 hours)
- Identify all platforms where the target company has reviews (G2, Capterra, Trustpilot, App Store, Google Play, Amazon, industry-specific platforms)
- Run AI-powered review analysis on each platform to extract themes, sentiment, and trends
- Aggregate findings into a single intelligence picture
- Compare review sentiment to management's claims about customer satisfaction
Phase 2: Competitive Analysis (3-4 hours)
- Identify 3-5 direct competitors
- Run the same review analysis on each competitor
- Build a comparative matrix: sentiment trends, feature gaps, support quality, pricing perception
- Identify the target company's relative strengths and vulnerabilities
Phase 3: Trend Analysis (1-2 hours)
- Plot sentiment trends for the target and competitors over the past 2 years
- Identify inflection points — when did sentiment change, and can you correlate with product updates, pricing changes, or market events?
- Project forward — if current trends continue, where will sentiment be in 12 months?
Phase 4: Synthesis (1-2 hours)
- Compile findings into a review-based due diligence report
- Identify 3-5 key findings that should influence the investment decision
- Formulate specific questions for management based on review findings
- Assess whether review data confirms, contradicts, or nuances the financial picture
Total time: 7-11 hours for a thorough review-based due diligence. With AI-powered tools, Phase 1 and Phase 2 can each be compressed to under an hour.
Case Study: How Review Analysis Changed an Investment Decision
A growth-stage venture fund was evaluating a Series B investment in a workforce management SaaS company. The financials looked strong: $8M ARR, 130% net revenue retention, 18-month payback period. The management team was experienced and the market was large.
What the Financials Said
- Revenue growing 80% year-over-year
- Gross margins at 78%
- Low customer acquisition cost relative to LTV
- Strong expansion revenue from existing customers
What the Reviews Said
The investor ran a review analysis across G2, Capterra, and Trustpilot — covering the target company and three competitors.
Finding 1: Declining satisfaction among tenured customers. Reviews from customers using the product for 2+ years rated it an average of 3.6 stars. Reviews from customers under 6 months rated it 4.5 stars. This divergence suggested that the product was impressive initially but failed to retain satisfaction long-term. The 130% net revenue retention looked healthy, but the review data suggested it was driven by price increases and new feature upsells, not by deepening customer satisfaction.
Finding 2: A competitor was eating the high end of the market. Reviews for Competitor B showed a clear pattern — 40% of their reviewers mentioned switching from the target company, citing "better enterprise features" and "more reliable integrations." The target company's growth was happening at the SMB level while they were quietly losing enterprise customers to a competitor that was not on the fund's radar.
Finding 3: Support quality had declined significantly. Support-related complaints had gone from 8% of reviews to 23% over 18 months, corresponding to a period of rapid customer growth. The management team had not expanded support staff proportionally, and reviews were reflecting the impact.
The Decision
The fund did not pass on the deal. Instead, they used the review findings to:
- Negotiate a lower valuation based on the churn risk evidence
- Structure the investment with milestones tied to customer satisfaction metrics
- Require a board-approved plan for scaling the support organization
- Commission a deeper competitive analysis focused on the enterprise segment
The review analysis did not replace financial due diligence — it made the financial due diligence smarter by surfacing risks that the numbers alone could not show.
Sentimyne for Rapid Due Diligence
Traditional due diligence methods for evaluating customer sentiment — customer interviews, NPS surveys through the company, reference calls — all require the target company's cooperation and take weeks to execute. Review analysis requires neither.
Sentimyne enables investors to run comprehensive review-based due diligence in hours instead of weeks:
- 60-second SWOT analysis from any product URL across 12+ review platforms
- Competitive analysis — run the same analysis on competitor URLs for instant comparative intelligence
- No company cooperation required — all data is public and analysis is independent
- Trend visibility — track how sentiment and themes shift over time
For investors evaluating multiple deals, the Pro plan at $29/month provides unlimited analyses — enough to screen an entire pipeline. The Team plan at $49/month allows investment team members to collaborate on shared analyses and build institutional knowledge from review data across the portfolio.
The free tier offers 2 analyses per month, which is enough to run a preliminary screen on a single deal — the target company's product and one key competitor — before deciding whether to invest more time in a full review-based due diligence.
Frequently Asked Questions
How reliable is review data for investment decisions?
Review data is one signal among many, not a standalone decision-making tool. It excels at revealing customer satisfaction trends, competitive positioning, and product quality trajectories that financial data cannot capture. However, it should be cross-referenced with financial analysis, management interviews, and market research. Treat review analysis as a complement to traditional due diligence, not a replacement.
What if the target company has very few reviews?
Low review volume is itself a signal. A SaaS company with 3 years in market and fewer than 50 reviews across G2 and Capterra likely has low brand awareness, limited market presence, or a customer base that does not engage publicly. Analyze whatever reviews exist, but also investigate why the volume is low. In categories where competitors have hundreds of reviews, low volume is a competitive disadvantage.
Can companies manipulate their reviews to fool investors?
They can try, but it is increasingly difficult. G2, Capterra, and Trustpilot all have fraud detection systems. Look for review patterns that suggest manipulation — clusters of 5-star reviews from new accounts within a short timeframe, reviews with suspiciously similar language, or a bimodal distribution with no middle ratings. AI analysis tools can flag these patterns automatically.
How should review analysis weight different platforms?
Weight platforms based on relevance to the target company's market. For B2B SaaS, G2 and Capterra carry the most weight. For consumer products, Amazon and Trustpilot dominate. For mobile apps, the App Store and Google Play are essential. For local services, Google Reviews and Yelp matter most. Analyze all relevant platforms and note any significant discrepancies between them.
Should investors share review analysis findings with the management team?
Yes, strategically. Present review findings during management meetings to gauge self-awareness and response quality. A management team that is surprised by well-known customer complaints is disconnected from their users. A team that acknowledges the issues and presents a credible remediation plan demonstrates operational maturity. How management responds to review-based questions is as valuable as the review data itself.
Ready to try AI-powered review analysis?
Get 2 free SWOT reports per month. No credit card required.
Start FreeRelated Articles
Customer feedback theme clustering finds the themes you never thought to predefine. The pipeline, how many clusters to keep, and how to validate them.
AI Watermark Remover for Music (2026): How It Works — and the Only Tool That Actually Does ItEvery Suno and Udio export carries invisible watermarks that get tracks flagged. Undetectr.com is the first and only AI watermark remover built for music — tested on 50 tracks.
Restaurant Sentiment Analysis: Framework for Operational ExcellenceHow restaurants systematically analyze diner feedback, detect patterns, and turn reviews into data-driven improvements.