Review Analysis for Franchises: Multi-Location Intelligence at Scale
Learn how to analyze reviews across franchise networks with 10 to 1,000+ locations. Covers multi-location dashboard design, location benchmarking, identifying top and bottom performers, scaling review response, corporate versus local strategy, franchisee accountability, and tools for managing brand consistency across distributed operations.
Managing reviews for a single-location business is straightforward. You monitor one Google Business Profile, respond to reviews as they come in, and track your rating over time. The workflow fits neatly into a daily routine that one person can handle.
Now multiply that by 150 locations across 12 states, each with its own Google Business Profile, its own Yelp page, its own set of platform-specific listings, and its own local management team with varying levels of engagement and quality. The franchise review management challenge is not a scaled-up version of single-location review management. It is a fundamentally different operational problem that requires different tools, different processes, and different organizational structures.
Franchise networks generate review data at a scale that makes manual monitoring impossible but also at a scale that makes the data extraordinarily valuable. When you have 150 locations, you have a natural experiment running constantly — the same brand, the same products, the same training materials, but different management, different staff, different local markets, and different customer outcomes. The variation in review data across locations reveals exactly which operational factors drive customer satisfaction and which locations need intervention.
This article covers the specific challenges of franchise review analysis, how to design multi-location dashboards, how to benchmark and compare locations, how to scale review response without losing quality, and how to structure the relationship between corporate and franchisee in review management.
The Franchise Review Challenge
Franchise review management is difficult for structural reasons that do not exist in single-location businesses.
Scale and Fragmentation
A franchise network with 200 locations has approximately 200 Google Business Profiles, 150-200 Yelp listings, 100+ Facebook pages, and dozens of industry-specific platform listings. Across these platforms, the network might generate 500-2,000 new reviews per month. No human team can monitor, categorize, analyze, and respond to this volume manually with any consistency.
Ownership Ambiguity
Who owns the review response? In most franchise models, this is unclear. The franchisee operates the location and directly controls the customer experience. But the franchisor owns the brand and is damaged when any single location receives poor reviews. Some franchise agreements specify review management responsibilities. Most do not.
| Responsibility | Typically Franchisor | Typically Franchisee | Often Unclear |
|---|---|---|---|
| Setting review standards | Yes | ||
| Monitoring reviews | Sometimes | Often | |
| Responding to positive reviews | Yes | ||
| Responding to negative reviews | Yes | ||
| Review solicitation strategy | Yes | ||
| Escalation of serious complaints | Yes | ||
| Aggregate reporting | Yes | ||
| Local reputation strategy | Yes |
This ambiguity creates gaps where reviews go unmonitored, unresponded, and unanalyzed for weeks — damaging both the local location and the overall brand.
Brand Consistency vs. Local Autonomy
Franchise brands need consistent review responses that maintain brand voice and comply with legal guidelines. But they also need responses that feel local, personal, and authentic — not like template robot replies. Balancing brand consistency with local authenticity is one of the hardest communication challenges in franchise management.
"The franchise review management paradox: you need enough centralization to maintain brand consistency and enough decentralization to maintain local authenticity. The solution is not choosing one — it is building systems that enable both simultaneously."
Franchisee Variability
The hardest truth in franchise review analysis is that most review problems are operational problems in disguise. A location with a 3.2-star rating does not have a review problem — it has a service, staffing, or management problem that manifests in reviews. Identifying and addressing these operational root causes requires review data that is structured, comparable, and actionable at the individual location level.
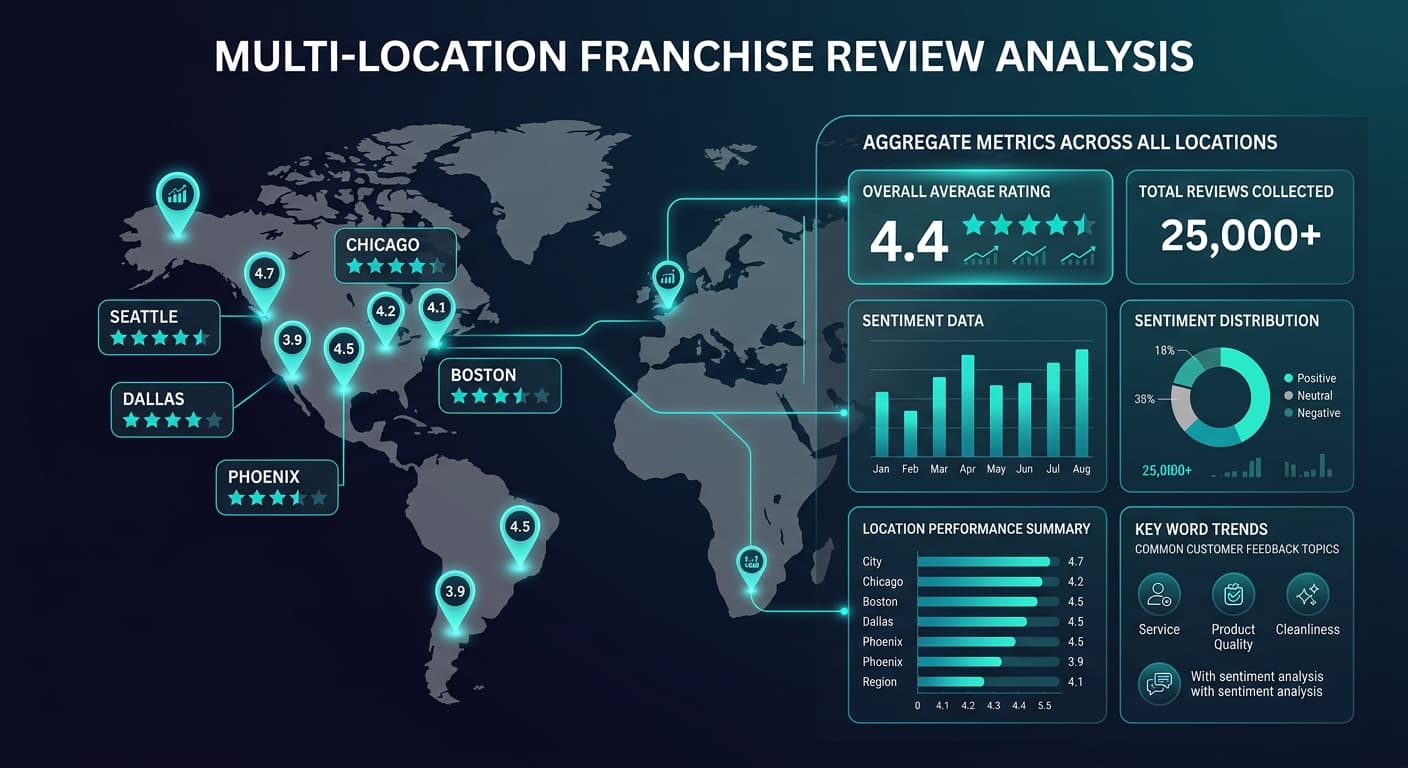
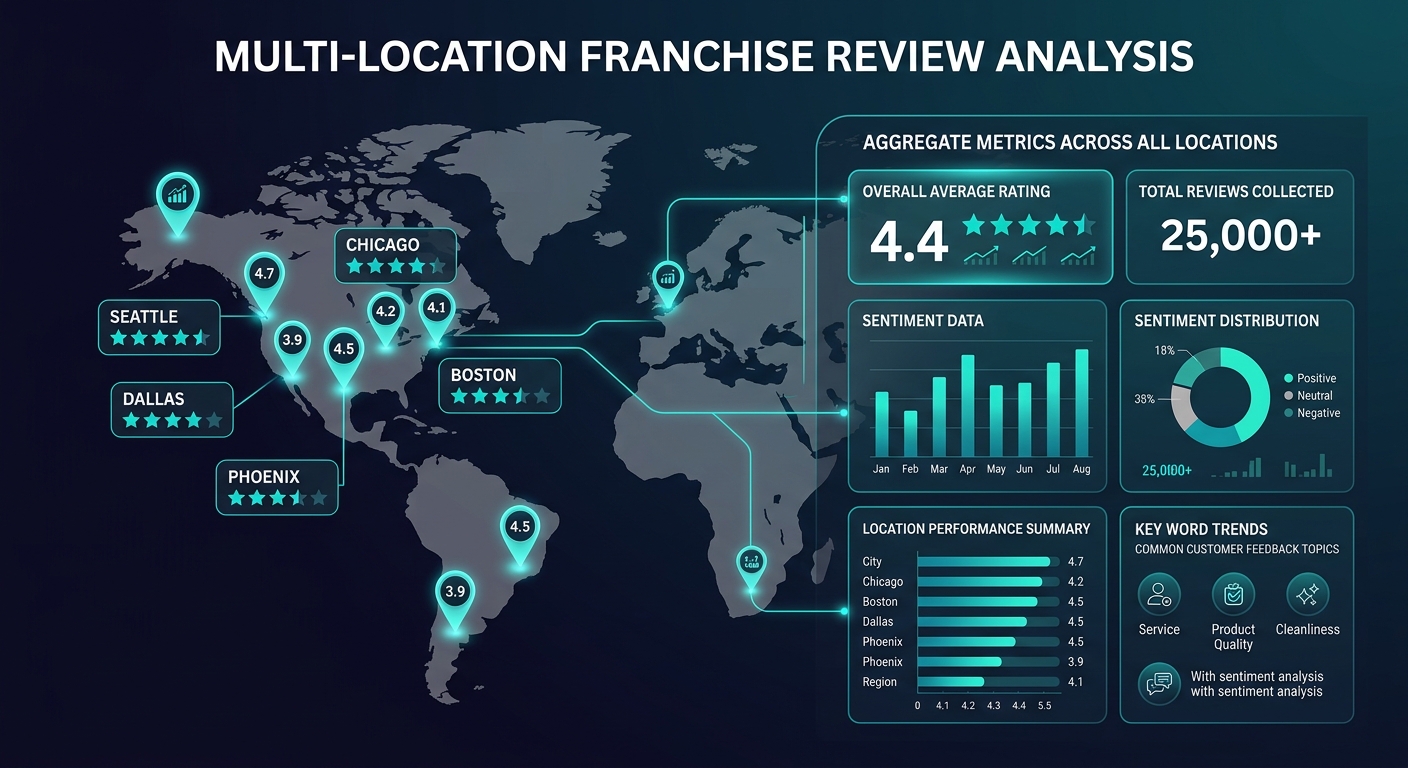
Multi-Location Dashboard Design
The foundation of franchise review management is a dashboard that presents multi-location data in a way that supports both high-level oversight and location-specific drilling.
The Executive View
The top-level dashboard should answer these questions at a glance:
- What is the network-wide average rating?
- How many new reviews were received this week/month across all locations?
- Which locations are above/below the network average?
- Which locations have trending sentiment shifts (improving or declining)?
- What is the overall review response rate?
- What are the top positive and negative themes across the network?
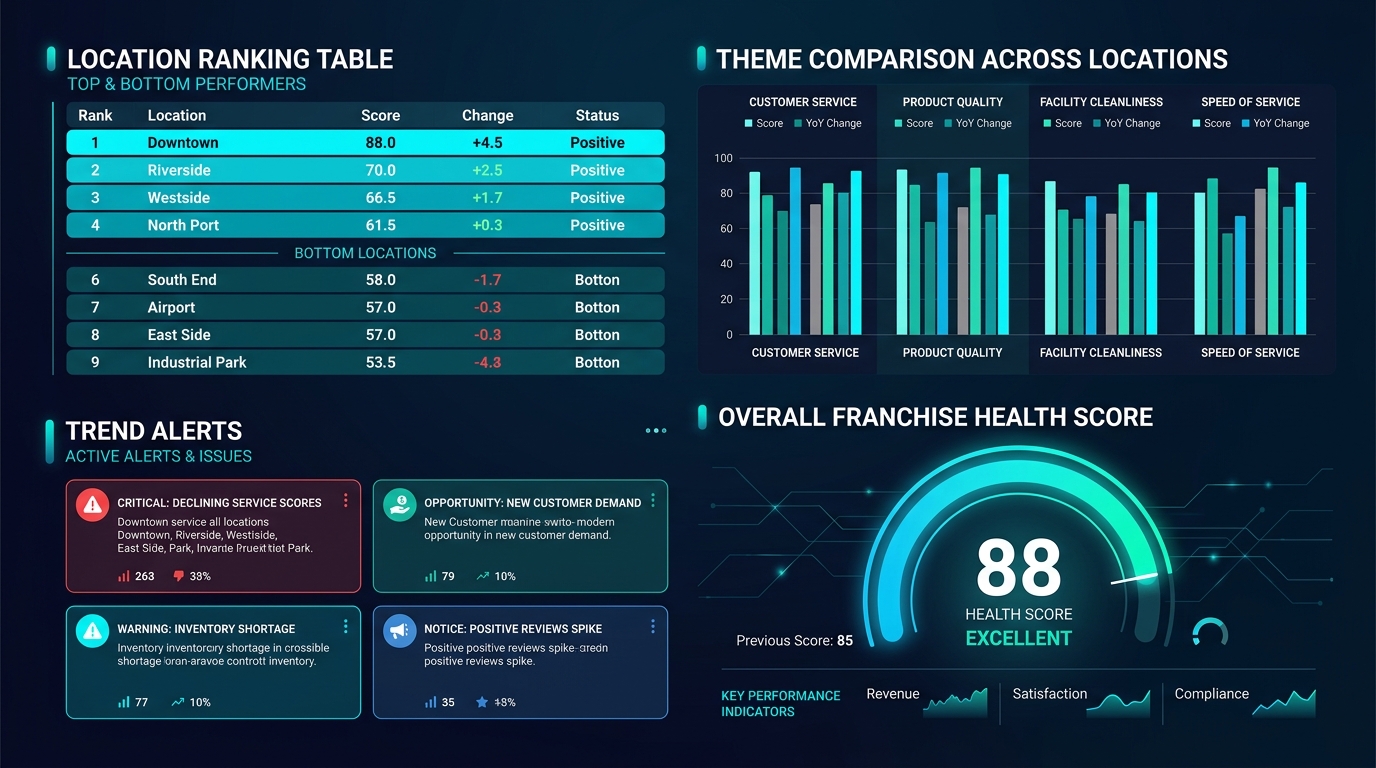
The Location Comparison View
This view ranks all locations by key metrics, enabling immediate identification of top and bottom performers.
| Location | Rating | Reviews (Total) | Reviews (30d) | Velocity | Response Rate | Top Complaint |
|---|---|---|---|---|---|---|
| #047 Denver | 4.7 | 423 | 18 | Strong | 94% | Wait time |
| #012 Austin | 4.6 | 381 | 22 | Strong | 88% | Parking |
| #089 Portland | 4.5 | 295 | 15 | Moderate | 91% | None dominant |
| ... | ... | ... | ... | ... | ... | ... |
| #156 Tampa | 3.4 | 187 | 8 | Weak | 42% | Staff attitude |
| #203 Houston | 3.1 | 214 | 4 | Critical | 18% | Cleanliness |
| #078 Miami | 2.9 | 156 | 6 | Weak | 23% | Quality |
This comparison view immediately surfaces the locations that need attention. In this example, locations 156, 203, and 078 have below-average ratings, low velocity, poor response rates, and specific complaint themes that suggest operational issues.
The Individual Location View
Drilling into a specific location shows:
- Rating trend over time (monthly, quarterly, annually)
- Theme breakdown for that location specifically
- All recent reviews with sentiment tags
- Response status and response time metrics
- Comparison to regional average and network average
- Flagged reviews requiring corporate attention
Key Dashboard Metrics
These are the metrics every franchise dashboard should track:
| Metric | Formula | Benchmark Target |
|---|---|---|
| Network Average Rating | Sum of all location ratings / number of locations | 4.0+ |
| Location Rating Variance | Standard deviation of location ratings | Below 0.5 |
| Network Response Rate | Reviews responded to / total reviews (all locations) | 80%+ |
| Average Response Time | Mean time from review posted to response posted | Under 24 hours |
| Review Velocity (Network) | Total new reviews per month across all locations | Growing or stable |
| Velocity Variance | Standard deviation of per-location velocity | Low (consistent solicitation) |
| Theme Concentration | % of negative reviews about a single theme | Below 40% (diversified issues vs. systemic) |
| Bottom Quartile Gap | Network average - bottom 25% average | Below 0.8 stars |
Location Benchmarking
The power of franchise data is comparative analysis. When you have dozens or hundreds of locations operating under the same brand, differences in review performance isolate the variables that matter.
Peer Group Comparison
Not all locations should be compared to the same benchmark. A flagship downtown location with 500 daily customers operates in a different context than a suburban strip-mall location with 100. Create peer groups based on:
- Market size — metro, suburban, rural
- Location age — under 1 year, 1-3 years, 3+ years
- Format type — standalone, mall, drive-through, delivery-only
- Region — accounting for cultural and demographic differences
- Volume tier — high-volume, moderate-volume, low-volume
A location rated 4.1 in a high-volume metro market may be outperforming a location rated 4.3 in a low-volume suburban market when context is factored in.
Identifying Top Performers
Top-performing locations (top 10-15% by rating and velocity) are your franchise's natural laboratory. Study their reviews to identify:
- What do customers consistently praise?
- Which themes are absent from their negative reviews that are present in underperformers?
- What operational practices differ? (often revealed through review content mentioning specific employees, processes, or experiences)
- What is their review solicitation approach?
These insights become training materials and best practices for underperforming locations. Real review data from top performers is more persuasive to struggling franchisees than abstract corporate directives.
For a comprehensive methodology on comparative review analysis, see our benchmark products against competitor reviews guide — the framework applies equally to internal franchise comparison.
Identifying Bottom Performers
Bottom-performing locations (bottom 10-15% by rating) require different analysis:
- Is the poor performance recent (suggesting a new problem) or chronic (suggesting structural issues)?
- Do the negative reviews cluster around a single theme (suggesting a specific fixable problem) or are they diverse (suggesting systemic management failure)?
- Does the location have low velocity (suggesting disengaged management that is not soliciting reviews) or high velocity with low ratings (suggesting genuine service problems)?
- How does the location's response rate compare to the network average?
"In franchise review analysis, the most dangerous location is not the one with a 2.5-star rating — that one is obviously failing and gets attention. The most dangerous location is the one with a 3.8-star rating that is declining at 0.1 stars per quarter. It still looks fine on the dashboard, but it will be at 3.4 in a year. Trend detection is more important than snapshot ratings."
Scaling Review Response
Responding to reviews across 200 locations generates 500-2,000 responses per month. Here are the models that work at franchise scale.
Model 1: Centralized Response Team
A small team at corporate headquarters responds to all reviews across all locations. This ensures brand consistency and quality but can feel generic and lacks local knowledge.
Best for: Franchises with fewer than 50 locations, franchises where brand voice matters more than local knowledge, franchises where franchisees are not equipped to respond.
Model 2: Decentralized Franchisee Response
Each franchisee (or their local manager) responds to their own location's reviews. This produces local, authentic responses but introduces quality variance and compliance risk.
Best for: Franchises with strong, engaged franchisees, franchises where local knowledge is essential to meaningful responses, brands that value authenticity over consistency.
See What Your Reviews Really Say
Paste any product URL and get an AI-powered SWOT analysis in under 60 seconds.
Try It Free →Model 3: Hybrid (Recommended)
Corporate provides response templates, guidelines, and training. Franchisees customize and post responses for their locations. Corporate monitors response quality, response time, and escalates locations that fall below standards.
Implementation structure:
| Review Type | Who Responds | Corporate Role |
|---|---|---|
| 5-star positive | Local franchisee | Quality audit (sample) |
| 4-star positive | Local franchisee | Quality audit (sample) |
| 3-star neutral | Local franchisee | Review before posting |
| 2-star negative | Local franchisee | Review before posting, approve |
| 1-star negative | Corporate drafts, local posts | Full control |
| Legal/safety/PR risk | Corporate only | Full control |
| Reviews mentioning corporate policies | Corporate only | Full control |
This hybrid model gives franchisees ownership of routine responses while ensuring corporate controls the narrative on sensitive issues.
Response Templates for Franchise Use
Franchise response templates need to be flexible enough for local customization while maintaining brand standards. The structure should include:
Required elements: Thank the reviewer, acknowledge specific feedback, include a next step or invitation.
Customizable elements: Local manager name, specific details referenced from the review, local offers or invitations.
Prohibited elements: Defensive language, blame-shifting, disclosure of internal policies or employee information, any promise that creates legal liability.
For a comprehensive guide on review response strategy, including templates and timing, see our how to respond to negative reviews guide.
Corporate vs. Local Strategy
Franchise review management operates on two strategic levels, and they must be aligned.
Corporate Strategy
The franchisor should own:
Standards and training. Define the review management playbook: response time SLAs, tone guidelines, escalation procedures, prohibited language, review solicitation compliance.
Technology. Select and deploy the review monitoring platform. This is not a decision that should be left to individual franchisees — you need a unified system that aggregates data across all locations into a single dashboard.
Aggregate analysis. Identify network-wide themes, track brand-level trends, conduct competitive analysis against other franchise brands, and produce quarterly review intelligence reports.
Intervention programs. Develop playbooks for locations that fall below performance thresholds — specific action plans triggered by specific review data indicators.
Local Strategy
The franchisee should own:
Daily monitoring. Checking for new reviews and responding within the SLA defined by corporate.
Review solicitation. Implementing the review generation system at their location — asking customers, deploying QR codes, sending post-visit emails.
Operational response. When review analysis identifies a specific operational issue (slow service, cleanliness complaints, staff attitude), the franchisee owns the fix.
Local reputation building. Engaging with the local community, building relationships with local media and influencers, and managing the location's Google Business Profile.
Alignment Mechanisms
The strategies stay aligned through:
- Monthly review scorecards sent from corporate to each franchisee, showing their location's performance relative to the network
- Quarterly review meetings where corporate and franchisee discuss review trends and action plans
- Annual review performance as a franchise agreement KPI — some forward-thinking franchise systems include review rating minimums in franchise agreements
- Franchisee recognition programs that celebrate top-performing locations based on review metrics
Franchisee Accountability
Review data provides an objective, customer-sourced measure of franchisee performance that is harder to dispute than corporate quality audits or mystery shopper reports.
The Review Performance Framework
Structure accountability around measurable review KPIs with clear thresholds:
| KPI | Green (On Track) | Yellow (Warning) | Red (Intervention) |
|---|---|---|---|
| Average Rating | 4.0+ | 3.5 - 3.9 | Below 3.5 |
| Rating Trend (90-day) | Stable or improving | Declining 0.1-0.2 | Declining 0.3+ |
| Response Rate | 80%+ | 50-79% | Below 50% |
| Response Time | Under 24 hrs | 24-72 hrs | Over 72 hrs |
| Review Velocity | Above network average | Within 25% of average | Below 50% of average |
| Negative Theme Concentration | Below 30% | 30-50% | Above 50% (systemic issue) |
Locations in the green zone receive recognition. Yellow triggers a review performance improvement plan. Red triggers direct corporate intervention with a defined timeline for improvement.
Using Review Data in Franchise Relationship Management
Review data is particularly valuable during:
- Franchise renewal decisions — objective performance data supporting renewal or non-renewal
- Multi-unit expansion approvals — does the franchisee's existing location performance justify additional locations?
- Training needs assessment — which locations need which types of training, based on their specific negative review themes?
- Capital improvement prioritization — review data can justify (or deprioritize) renovation investments based on customer feedback
Tools for Franchise Review Management
Manual monitoring does not work at franchise scale. The right technology stack includes:
Review aggregation platform. A tool that pulls reviews from all platforms for all locations into a single dashboard. This is the foundation — without aggregation, you cannot compare, benchmark, or analyze at scale.
Sentiment and theme analysis. AI-powered analysis that automatically categorizes review themes and sentiment across all locations. Manual categorization at franchise volume is not feasible.
Alert and escalation system. Automated alerts when a location receives a 1-star review, when a location's rating drops below a threshold, or when response time exceeds the SLA.
Response management. A centralized platform where responses can be drafted, approved, and posted — with workflow support for the hybrid response model.
Sentimyne is built for this kind of multi-location analysis. The free tier at 2 analyses per month lets you evaluate the platform with a sample of locations. The Pro plan at $29/month supports ongoing monitoring for smaller franchise networks. The Team plan at $49/month is designed for multi-user, multi-location operations where corporate and franchisee teams need shared access to review intelligence dashboards.
For franchises already using business intelligence tools, see our how to present review data to stakeholders guide for frameworks on integrating review insights into existing reporting.
Frequently Asked Questions
How many reviews should each franchise location aim for?
The target depends on industry, market size, and competitive landscape, but a general benchmark for franchise locations is 50+ Google reviews to establish credibility, with a monthly velocity of 5-15 new reviews to maintain ranking competitiveness. More important than the absolute number is relative performance — each location should aim to match or exceed the review count and velocity of the top-ranked competitors in its specific local market. Locations in dense metro markets need higher volume than suburban or rural locations. Track the top three competitors on Google Maps for each location and set location-specific targets based on that competitive context.
Should franchise review responses be centralized or handled by individual franchisees?
The most effective model for franchises with more than 20 locations is a hybrid approach. Franchisees respond to routine positive and moderately positive reviews with local knowledge and authenticity. Corporate drafts or approves responses to negative reviews, especially those involving policy disputes, safety concerns, or potential legal issues. Corporate also provides response templates, training, and quality monitoring. This balances brand consistency with local authenticity. Purely centralized responses feel robotic. Purely decentralized responses introduce unacceptable quality variance and compliance risk.
How do you identify whether a franchise location's poor reviews reflect local issues or brand-wide problems?
Compare the struggling location's negative review themes against the network average. If the location's top complaints also appear across the network (for example, pricing or wait times), the issue is brand-wide and requires corporate-level intervention. If the location's complaints are unique to that location (staff attitude, cleanliness, specific product quality), the issue is local and requires franchisee-level intervention. This comparison is only possible with standardized theme categorization across all locations — which is why AI-powered theme extraction is essential at franchise scale. Manual categorization produces inconsistent labels that make cross-location comparison unreliable.
Can franchise review data predict which locations are at risk of failure?
Yes, with meaningful reliability. Research shows that sustained review rating decline — specifically, a rating drop of 0.3 or more stars over six months — correlates strongly with declining revenue at franchise locations. Locations that drop below 3.5 stars on Google and remain there for two or more quarters show revenue declines of 15-30% compared to their prior baseline. Low review velocity (especially when combined with declining ratings) is another leading indicator, as it suggests the franchisee has disengaged from customer relationship management. By tracking these leading indicators, corporate can intervene before a location reaches the point of financial distress.
What review management technology is essential for franchise networks with 100+ locations?
At 100+ locations, you need four capabilities that no manual process can provide. First, automated multi-platform aggregation that pulls reviews from Google, Yelp, Facebook, and industry platforms into a single dashboard for all locations. Second, AI-powered theme and sentiment analysis that applies consistent categorization across thousands of reviews per month. Third, a workflow-enabled response system that supports drafting, approval routing, and posting — with role-based access for corporate and franchisee users. Fourth, benchmarking and alerting that automatically compares location performance, flags underperformers, and triggers escalation workflows. Sentimyne's Team plan provides these capabilities at a price point designed for franchise operations.
Ready to try AI-powered review analysis?
Get 2 free SWOT reports per month. No credit card required.
Start FreeRelated Articles
The average multi-location brand responds to only 35% of negative reviews. Learn how chains, franchises, and multi-site businesses can centralise review monitoring, maintain brand voice, empower local teams, and use review data strategically across 10 to 10,000 locations.
Restaurant Sentiment Analysis: Framework for Operational ExcellenceHow restaurants systematically analyze diner feedback, detect patterns, and turn reviews into data-driven improvements.
Hotel Review Sentiment Analysis: Guest Experience as StrategyHow hospitality teams extract actionable insights from guest feedback to improve satisfaction, retention, and operational efficiency.