Facebook & Instagram Review Analysis: Social Proof Intelligence From Meta Platforms
Master Facebook and Instagram review analysis for social proof intelligence. Covers Facebook Recommendations, Page Reviews, Instagram comment sentiment, Marketplace reviews, local business vs e-commerce analysis, and integrating Meta feedback with structured review platforms.
Facebook and Instagram collectively reach 3.98 billion monthly active users — more than any other platform combination on the internet. For businesses, this audience is not just a marketing channel. It is a feedback ecosystem that generates reviews, recommendations, comments, direct messages, group discussions, and marketplace ratings at a scale that dwarfs dedicated review platforms.
Yet most businesses analyze their Meta feedback poorly, if at all. Facebook Recommendations are checked sporadically. Instagram comment sentiment is never systematically tracked. Marketplace reviews are ignored by the parent brand. Group discussions happen without the company's knowledge. The result is a massive blind spot in the customer intelligence picture.
A 2025 Meta business survey found that 68% of consumers have discovered a new business through Facebook Recommendations, and 74% of Instagram users say they have formed an opinion about a product from Instagram comments and posts. These are not marginal channels. For many businesses — particularly local services, restaurants, e-commerce brands, and direct-to-consumer products — Meta platforms are the primary place where customer opinions are formed and shared.
This guide covers how to systematically analyze feedback from Facebook and Instagram — understanding the unique feedback types on each platform, extracting sentiment from unstructured social data, measuring social proof impact, and integrating Meta feedback with structured review analysis for a complete picture.
Types of Meta Feedback: A Complete Taxonomy
Before analyzing feedback, you need to understand all the forms it takes across Meta's ecosystem. The variety is much broader than most businesses realize.
Facebook Recommendations (The "New" Reviews)
In 2018, Facebook replaced its 5-star review system with a binary Recommendations system. Instead of rating 1-5 stars, users now simply answer: "Do you recommend [business]?" with a Yes or No, followed by optional text, tags, and photos.
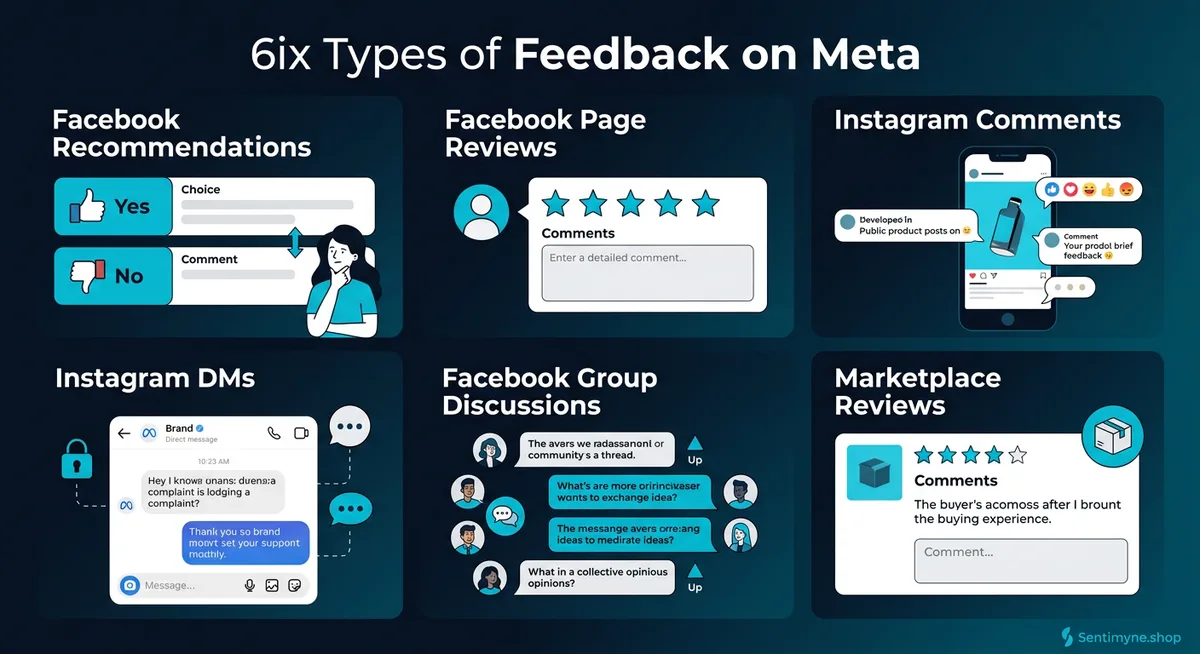
What the Recommendation system captures: - Binary recommendation — Yes or No (displayed as a percentage: "87% of people recommend this business") - Text feedback — Optional narrative about the experience - Tags — Predefined tags like "Great Service," "Pet Friendly," "Good for Groups" - Photos — Visual evidence of the experience
What changed from the old 5-star system: - The binary system eliminates granularity. There is no difference between "good" and "amazing" — both are "Yes." - The percentage display ("92% recommend") is arguably more persuasive than a numerical rating — humans process percentages intuitively. - Text feedback has become shorter on average, as the simplified system reduces the pressure to write a detailed review. - Only recommendations with text appear on the business page. A "Yes" without text counts toward the percentage but is not visible as a review.
Legacy Facebook Page Reviews (Pre-2018)
Businesses that existed before 2018 may still display old 5-star reviews alongside new Recommendations. These legacy reviews cannot be edited or converted — they persist in their original format.
For analysis, legacy reviews and new Recommendations should be tracked separately because: - Star ratings provide granularity that binary recommendations do not - Old reviews reflect different customer expectations and platform dynamics - Mixing the formats in analysis creates inconsistencies
Instagram Comments: Unstructured Sentiment
Instagram does not have a formal review system. Instead, product feedback is embedded in:
- Post comments — Reactions to product photos, launch announcements, and promotional content
- Reel comments — Often more candid and impulsive than post comments
- Story replies — Private responses to stories, visible only to the business
- Tagged post comments — Comments on user-generated content that tags your brand
Instagram comment sentiment analysis is challenging because: - Comments are short (often 1-5 words) - Emoji-only comments require emoji sentiment mapping - Sarcasm and irony are prevalent - Bot comments and generic praise ("Nice!" "Love it!") create noise
Despite these challenges, Instagram comments at scale reveal genuine product perception. A product post with 200 comments where 35% ask about a specific feature tells you something important about demand. A post with comments predominantly asking about price signals price sensitivity in your audience.
Facebook Group Discussions
Facebook Groups are where the longest, most detailed Meta feedback lives. Groups create community contexts that encourage honest, extended discussion:
- Brand community groups — Both official and fan-created groups for your brand
- Category groups — "[City] restaurant recommendations," "Best budget tech gadgets," "SaaS founders community"
- Competitor groups — Your competitor's official community groups (yes, you should monitor these)
Group feedback characteristics: - Longer form — Average group comment is 40-60 words, compared to 5-15 words on Instagram - More honest — Group dynamics encourage candid feedback, especially in recommendation threads - Peer-validated — Comments with many Likes/reactions represent community-validated opinions - Recurring — The same questions and opinions surface repeatedly, making themes easy to identify
Facebook Marketplace Reviews
For businesses that sell through Facebook Marketplace — particularly e-commerce, secondhand goods, and local services — Marketplace has its own rating system. Buyers and sellers rate each other, and these ratings are visible on profiles.
Marketplace reviews tend to focus on: - Transaction reliability (did the seller ship on time, was the item as described) - Communication quality (response speed, clarity, professionalism) - Pricing fairness (was the price reasonable for the condition) - Packaging and delivery (condition on arrival, shipping speed)
Direct Messages (DMs)
Both Facebook Messenger and Instagram DMs contain valuable feedback that never appears publicly. Common DM feedback includes:
- Pre-purchase questions — "Do you have this in size X?" or "When will [product] be back in stock?"
- Post-purchase complaints — Customers often DM complaints before (or instead of) leaving public reviews
- Feature requests — "It would be great if your product could [X]"
- Praise and testimonials — Some customers prefer private feedback
DMs are one-to-one and cannot be scraped or analyzed automatically through most tools. They require manual aggregation, which makes them frequently overlooked despite their high intelligence value.
How Facebook's Recommendation System Changed Reviews
The shift from 5-star reviews to binary recommendations fundamentally changed how businesses should analyze Facebook feedback.
The Binary Problem
A 5-star system captures sentiment gradations. A 4-star review communicates something meaningfully different from a 2-star review. The binary system collapses all positive sentiment into "Yes" and all negative sentiment into "No."
This means: - You cannot distinguish between satisfied and delighted customers from the rating alone — both are "Yes" - You cannot distinguish between disappointed and furious customers — both are "No" - Text analysis becomes essential because the binary rating lacks the granularity to differentiate experience quality
For businesses with high recommendation percentages (>90%), the percentage itself provides little diagnostic value. The text accompanying recommendations is where the intelligence lives.
The Visibility Threshold
Facebook's algorithm favors businesses with higher recommendation percentages in local search and suggestions. The critical thresholds:
| Recommendation % | Visibility Impact | Consumer Perception |
|---|---|---|
| 95-100% | Maximum visibility boost | Strong social proof |
| 85-94% | Moderate visibility boost | Positive perception |
| 70-84% | Neutral | Adequate but not compelling |
| 50-69% | Reduced visibility | Concerning to potential customers |
| Below 50% | Significant visibility reduction | Active deterrent |
Tag Analysis
The predefined tags that accompany Facebook Recommendations are an underutilized data source. When aggregated, they reveal what customers notice and value most:
For a restaurant, the tag frequency might show: - "Great Food" — 78% of recommendations - "Good for Groups" — 45% - "Cozy Atmosphere" — 38% - "Friendly Staff" — 52% - "Good Value" — 29%
These percentages tell you that food quality and staff friendliness are your primary perceived strengths, while value perception is comparatively weak. This is structured data — easy to analyze and track over time.
Analyzing Instagram Comments for Product Sentiment
Instagram comment analysis requires different techniques than structured review analysis because the data is fundamentally unstructured.
Building a Comment Classification System
For any Instagram post, classify comments into categories:
Product-related: - Feature questions — "Does this come in other colors?" - Quality feedback — "Had mine for 6 months and it is still perfect" - Price reactions — "How much is this?" - Comparison — "Is this better than [competitor]?" - Purchase intent — "Where can I buy this?" or "Just ordered!"
Non-product (filter out): - Generic praise — "Love it!" "Amazing!" - Emoji-only — Various heart and fire emojis - Bot comments — "DM me for followers" etc. - Tag comments — "@friend look at this" - Off-topic — Unrelated to the product
A typical product post sees 60-75% non-product comments and 25-40% product-related comments. Focus your analysis exclusively on the product-related subset.
Emoji Sentiment Mapping
Instagram comments are heavily emoji-driven. For sentiment analysis, map common emojis to sentiment values:
| Emoji Category | Examples | Sentiment Signal |
|---|---|---|
| Hearts and love | Red heart, heart eyes, sparkle heart | Strongly positive |
| Fire and celebration | Fire, 100, party | Positive |
| Thinking and questioning | Thinking face, eyes | Neutral/curious |
| Disappointment | Thumbs down, sad face, broken heart | Negative |
| Laughter | Crying laughing, skull (slang for "dead/hilarious") | Context-dependent |
Emoji-only comments in aggregate provide a quick sentiment snapshot. A post where 80% of emoji comments are hearts and fire emojis has different sentiment than one where 30% are thinking or questioning emojis.
Instagram Reel Comments vs. Post Comments
Reels generate significantly different comment patterns than static posts:
- Reel comments are more impulsive — Viewers comment while watching, leading to shorter, more emotional reactions
- Reel comment volume is higher — The algorithm pushes Reels to broader audiences, generating more casual engagement
- Reel comments have more noise — A higher percentage of non-product comments
- Reel comments surface different issues — Visual product performance, sound quality for tech products, real-world usage impressions
For product intelligence, static post comments tend to be more analytically valuable per comment, while Reel comments provide broader sentiment signals.
Social Proof Impact on Purchase Decisions
Understanding how Meta feedback affects buying behavior helps prioritize which feedback types to monitor and optimize.
The Social Proof Cascade
See What Your Reviews Really Say
Paste any product URL and get an AI-powered SWOT analysis in under 60 seconds.
Try It Free →Consumer purchase decisions on Meta platforms follow a cascade:
- Discovery — User sees a product through an ad, shared post, or recommendation
- Validation — User checks the business's Facebook page (recommendation %, text reviews)
- Social confirmation — User looks for friends who have liked/reviewed/interacted with the business
- Instagram verification — User visits the Instagram profile to assess visual quality and comment sentiment
- Decision — Purchase, visit, or pass
Research shows that social proof from known connections is 4x more influential than anonymous reviews. When a user's friend has recommended a business on Facebook, the conversion likelihood increases by 340% compared to seeing the same recommendation from a stranger.
Quantifying Social Proof Strength
For your business, assess your social proof strength across Meta:
| Social Proof Element | Your Status | Target | Impact Level |
|---|---|---|---|
| Facebook Recommendation % | Current % | >90% | High |
| Total Recommendations | Current count | >200 for local, >500 for regional | High |
| Instagram follower count | Current count | Category-dependent | Medium |
| Average comment count per post | Current average | >15 for local, >50 for brands | Medium |
| User-generated content volume | Monthly tagged posts | >20/month | Very high |
| Facebook Group membership | Current count | >500 active members | High |
The Comment Section as Social Proof
Instagram comment sections serve as public social proof beyond the review function. Potential customers scroll through comments to gauge:
- Sentiment ratio — Are most comments positive?
- Question responsiveness — Does the brand respond to questions?
- Customer photos — Do customers share their own images using the product?
- Community engagement — Does the brand create a community feeling in comments?
A product post with 150 enthusiastic comments, active brand responses, and customer photos serves as more powerful social proof than a 4.5-star rating on a review platform — because it is social, visual, and real-time.
Local Business vs. E-Commerce: Different Meta Strategies
Meta feedback analysis differs significantly based on business type.
Local Business Meta Analysis
For local businesses (restaurants, salons, gyms, professional services), Facebook is the dominant Meta feedback channel:
Primary data sources: - Facebook Recommendations (most important) - Facebook check-ins and tagged photos - Local Facebook Group mentions - Instagram location-tagged posts
Key metrics: - Recommendation percentage and text themes - Check-in frequency and peak times - Tag frequency by recommendation tag - Response rate and speed to reviews
Local-specific analysis: - Seasonal patterns — Do recommendations change by season? (Restaurants may see more negative feedback during peak tourist season) - Day-of-week patterns — Are there specific days with worse feedback? (Correlated with staffing or crowd size) - Competitor mentions — When customers recommend you, do they compare you to specific local competitors?
E-Commerce Meta Analysis
For e-commerce brands, Instagram becomes the dominant feedback channel:
Primary data sources: - Instagram post and Reel comments - Instagram DMs (pre-purchase questions, post-purchase complaints) - Facebook Page recommendations - User-generated content (tagged photos and videos)
Key metrics: - Comment sentiment ratio per product post - DM inquiry themes and frequency - User-generated content volume and sentiment - Ad comment sentiment (comments on promoted posts)
E-commerce-specific analysis: - Product-level sentiment — Which products generate the most positive vs. negative comments? - Ad comment sentiment — Comments on ads are brutally honest. Track the ratio of positive to negative ad comments as a real-time campaign health metric. - UGC quality — Are customers sharing high-quality images of your product? UGC quality reflects product quality perception. - Return/complaint patterns — DMs about returns and complaints reveal product quality issues faster than review platforms.
Challenges of Unstructured Social Feedback
Meta feedback analysis presents unique challenges that differ from structured review platforms.
Volume vs. Signal
A Facebook post might generate 500 comments, of which 15 contain actionable product feedback. The signal-to-noise ratio is dramatically lower than on dedicated review platforms. Effective analysis requires filtering systems that separate actionable feedback from generic social engagement.
Cross-Platform Consistency
A customer might leave a positive Facebook Recommendation but complain in an Instagram DM. Another might praise you in a Facebook Group but leave a negative Google review. Tracking customer sentiment across Meta's own fragmented ecosystem — let alone across external platforms — requires deliberate systems.
Algorithm-Influenced Visibility
Meta's algorithms determine which comments are visible by default (most posts show top comments, not all comments). This means the visible feedback on any given post is algorithmically curated, not representative. Analysis should consider all comments, not just the default-visible ones.
Ephemeral Content Feedback
Instagram Stories disappear after 24 hours. Story replies (which are DMs) contain feedback that is never publicly visible and has no persistent record unless manually saved. This creates a feedback channel that is valuable but difficult to systematically capture.
"The greatest challenge with Meta platform feedback is not finding it — it is that it exists in so many formats, across so many surfaces, that no single view captures the complete picture. The businesses that solve this aggregation problem have a fundamental intelligence advantage."
Using Sentimyne Alongside Social Analysis
Meta platform feedback provides volume, social context, and real-time sentiment. What it lacks is structure, consistency, and cross-platform comparability. This is where integrating social analysis with structured review platform analysis creates the most complete intelligence picture.
Sentimyne processes structured reviews from 12+ platforms — Google, Yelp, Amazon, G2, Trustpilot, and more — generating SWOT analysis, sentiment trends, and competitive intelligence in approximately 60 seconds from any product or business URL.
The Combined Intelligence Stack
| Intelligence Need | Best Source | Why |
|---|---|---|
| Real-time sentiment shifts | Instagram comments, Facebook posts | Immediate, high-volume |
| Quantitative trend tracking | Sentimyne (structured platforms) | Star ratings, category scores |
| Competitive benchmarking | Sentimyne multi-platform SWOT | Standardized cross-platform comparison |
| Qualitative depth | Facebook Group discussions, Instagram DMs | Extended, candid conversations |
| Social proof optimization | Meta analytics + review platform scores | Combined visibility impact |
| Local market intelligence | Facebook Recommendations + Google Reviews | Local search ecosystem coverage |
When Meta Feedback Contradicts Structured Reviews
If your Instagram comments are overwhelmingly positive but your Google reviews average 3.5 stars, several explanations are possible:
- Audience self-selection — Your Instagram followers are fans; your Google reviewers include a broader, less loyal audience
- Expectation gaps — Social media content sets expectations that the actual experience does not meet
- Platform-specific issues — The experience captured by Google reviewers (often post-purchase or post-visit) differs from the social media impression
- Comment curation — You may be deleting or hiding negative Instagram comments (which inflates apparent sentiment)
Sentimyne's cross-platform analysis reveals these discrepancies quantitatively. When you see that your Google and Yelp sentiment scores diverge from your perceived Meta sentiment, the structured data points you toward the actual customer experience rather than the curated social impression.
The free tier at 2 analyses per month allows you to establish your baseline across structured platforms and compare that reality against your Meta social proof metrics. Pro at $29/month and Team at $49/month support continuous monitoring for businesses managing multiple locations or product lines.
Building a Meta Feedback Analysis Workflow
For businesses serious about extracting intelligence from Meta platforms, implement this structured workflow:
Daily (10 minutes): - Check and respond to new Facebook Recommendations - Scan Instagram comments on recent posts for product-related feedback - Check Instagram DMs for customer inquiries and complaints - Flag any negative feedback for immediate follow-up
Weekly (30 minutes): - Categorize all product-related Instagram comments from the past week - Review Facebook Group mentions (your brand and competitors) - Assess comment sentiment on any paid ad campaigns - Track UGC volume and quality (tagged posts and stories)
Monthly (1 hour): - Run Sentimyne analysis across structured review platforms - Compare structured review sentiment to Meta social sentiment - Update tag frequency analysis from Facebook Recommendations - Calculate Instagram engagement quality metrics (product comment ratio, sentiment ratio) - Brief marketing team on emerging themes and sentiment shifts
Quarterly (2 hours): - Full cross-platform audit (Meta + Google + Yelp + industry-specific) - Assess social proof strength across all Meta surfaces - Competitive social proof comparison (your Meta presence vs. top 3 competitors) - Present findings and recommendations to stakeholders
Frequently Asked Questions
Can I still see old 5-star Facebook reviews on my business page?
Yes. Facebook did not delete pre-2018 star reviews when it switched to the Recommendations system. Old reviews with star ratings remain visible on your Page alongside newer Recommendations. However, your overall score is now displayed as a recommendation percentage, not a star average. For analytical purposes, you can still access and analyze these legacy reviews, but new visitors to your page primarily see the recommendation percentage and the most recent text reviews. If you have a large volume of legacy reviews, they provide historical sentiment data that can be compared against your current Recommendations to track how customer perception has changed over time.
How do I handle negative Instagram comments on my posts?
Do not delete them unless they violate community guidelines or are clearly spam. Deleting legitimate negative comments erodes trust — other users notice when comment sections feel artificially positive. Instead, respond professionally and specifically to the concern. Move the conversation to DMs for detailed resolution by saying something like "We want to make this right — sending you a DM now." This approach demonstrates responsiveness publicly while handling specifics privately. For products with consistently negative comment sections, investigate the root cause rather than managing the symptom — the comments are telling you something about product-market fit or expectation alignment.
How does Facebook's recommendation percentage affect my business's visibility in local search?
Facebook uses recommendation data as a signal in its local search and discovery algorithms. Businesses with higher recommendation percentages and more recent recommendations appear more prominently in local search results, the "Places" tab, and the "Nearby" suggestions feature. The exact algorithm is not public, but businesses with recommendation percentages above 90% and consistent recent activity (at least 2-3 new recommendations per month) receive meaningful visibility advantages. Below 70%, visibility drops noticeably. Importantly, recommendation velocity — the rate of new recommendations — matters more than total count, signaling to Facebook that the business is active and currently relevant.
Should I analyze Instagram ad comments differently than organic post comments?
Yes, significantly. Ad comments come from a fundamentally different audience — people who did not follow you and may be encountering your brand for the first time. This means ad comments reflect first-impression sentiment from cold audiences, while organic post comments reflect sentiment from existing followers who already have brand affinity. Ad comments tend to be more skeptical, more price-sensitive, and more likely to compare you to competitors. They are also more likely to contain objections that you should address in your ad copy and landing pages. Track ad comment sentiment separately from organic comment sentiment, and treat negative ad comments as purchase objection research — they tell you exactly what is preventing conversion.
What is the best way to encourage more Facebook Recommendations for my business?
The most effective method is timing: ask satisfied customers for recommendations at the moment of peak satisfaction. For restaurants, this is during a great meal (table cards with QR codes linking to your Facebook page). For services, this is immediately after successful completion. Keep the ask simple — "Would you recommend us on Facebook?" works better than elaborate review solicitation. Do not offer incentives for recommendations, as Facebook's policies prohibit this and incentivized recommendations tend to be generic and unhelpful for analysis. Also ensure your Facebook Page is claimed, complete, and easy to find — many customers who want to leave recommendations abandon the process if the page is hard to locate. Finally, respond to every recommendation you receive, as this creates a social feedback loop that encourages others to participate.
Ready to try AI-powered review analysis?
Get 2 free SWOT reports per month. No credit card required.
Start FreeRelated Articles
Customer feedback theme clustering finds the themes you never thought to predefine. The pipeline, how many clusters to keep, and how to validate them.
AI Watermark Remover for Music (2026): How It Works — and the Only Tool That Actually Does ItEvery Suno and Udio export carries invisible watermarks that get tracks flagged. Undetectr.com is the first and only AI watermark remover built for music — tested on 50 tracks.
Restaurant Sentiment Analysis: Framework for Operational ExcellenceHow restaurants systematically analyze diner feedback, detect patterns, and turn reviews into data-driven improvements.