TrustRadius Review Analysis: Enterprise B2B Software Intelligence
Master TrustRadius review analysis for enterprise B2B software intelligence. Covers TrustRadius's verified review system, multi-section review format, competitive intelligence from alternatives data, and how to extract sales enablement and product strategy insights.
TrustRadius occupies a unique position in the B2B software review ecosystem. While G2 and Capterra dominate in volume and visibility, TrustRadius has built its reputation on a single principle: no pay-to-play. Vendors cannot pay for placement, leads, or review solicitation through the platform. Every review is verified through a multi-step authentication process. And the review format itself demands a level of detail that most platforms do not require.
For enterprise software decisions — purchases that often exceed $50,000 annually and take 6-12 months to evaluate — this matters enormously. A 2025 TrustRadius buyer study found that 87% of enterprise buyers consult review sites during their evaluation process, and among those, 72% specifically seek out TrustRadius for its no-pay-to-play policy. These buyers are spending their company's money. They want reviews they can trust.
Yet most software vendors — even those with robust G2 and Capterra strategies — treat TrustRadius as an afterthought. They collect reviews reactively, rarely analyze them systematically, and miss the competitive intelligence embedded in the platform's unique review structure. That is a strategic gap worth closing.
This guide covers how to analyze TrustRadius reviews for maximum enterprise intelligence — understanding the platform's unique mechanics, extracting value from its multi-section format, leveraging the competitive "alternatives considered" data, and integrating TrustRadius insights into sales, product, and marketing strategies.

Why TrustRadius Matters for Enterprise Software
Before diving into analysis techniques, it is worth understanding what makes TrustRadius structurally different from other B2B review platforms and why those differences matter for enterprise buyers and vendors.
The No-Pay-to-Play Model
G2 and Capterra are advertising platforms that also host reviews. Vendors pay for category placement, lead generation, and featured positions. This creates an inherent conflict: the platforms generate revenue from the companies they are theoretically evaluating objectively.
TrustRadius operates differently. Vendors cannot:
- Pay for higher category placement
- Purchase leads generated from reviews
- Sponsor reviews or incentivize reviewers through the platform
- Buy featured positions or "Leader" badges
This model means TrustRadius has less revenue (it monetizes through licensing its review data and buyer intent signals), but the reviews themselves are less subject to vendor manipulation. Enterprise buyers know this, which is why TrustRadius reviews carry disproportionate credibility in evaluation committees and board presentations.
Verified Reviews Only
TrustRadius verifies every review through a multi-step process:
- LinkedIn authentication — Reviewers must connect their LinkedIn profile, verifying employment
- Business email verification — A corporate email address is required
- Content screening — Reviews are screened for promotional language, incomplete responses, and quality
- Usage verification — Reviewers confirm how long they have used the product and in what capacity
The result is a review corpus where every review comes from a verified user of the product. This contrasts with platforms where competitors can post fake reviews, vendors can incentivize employees to review, and anonymous users can post without verification.
For analysis purposes, this verification means TrustRadius reviews have significantly higher signal quality. Every review represents a real user with real experience. The noise floor is lower.
Detailed Multi-Section Format
TrustRadius reviews are not freeform text. The platform requires reviewers to address multiple specific sections, creating structured data that is far easier to analyze than paragraph-form reviews.
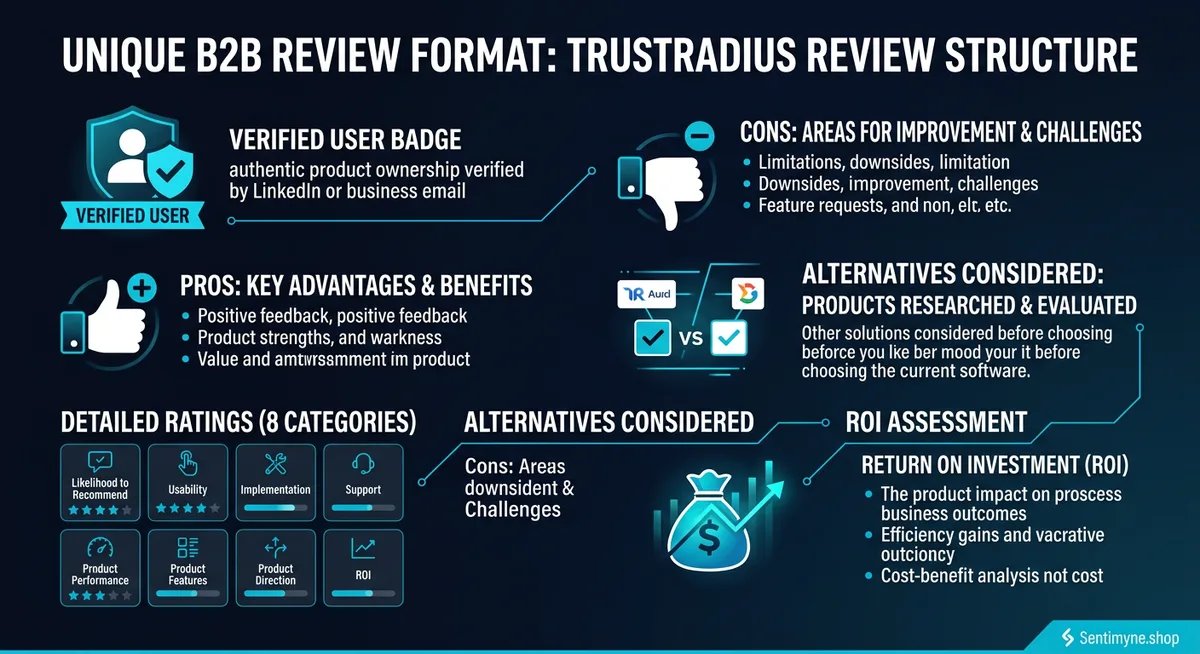
TrustRadius Review Structure: What Each Section Contains
Every TrustRadius review includes the following sections, each providing distinct intelligence:
Pros Section
Reviewers explicitly list what they like about the product. These are not buried in paragraphs — they are standalone, bulleted strengths. This structure makes positive theme extraction straightforward.
Common patterns in Pros sections: - Feature-specific praise — "The reporting dashboard is highly customizable" - Workflow improvements — "Reduced our monthly close process from 5 days to 2 days" - Integration quality — "Seamless integration with Salesforce and HubSpot" - Support quality — "Dedicated CSM who responds within 2 hours"
Cons Section
Equally explicit negative feedback, bulleted and specific. This section is gold for product teams because the feedback is structured and actionable.
Common patterns in Cons sections: - Feature gaps — "No native integration with Jira" - UX friction — "The admin panel is unintuitive and requires extensive training" - Performance issues — "Slow load times with large datasets (10,000+ records)" - Pricing concerns — "Per-seat pricing becomes prohibitive at scale"
Rating Categories (8 Dimensions)
TrustRadius collects ratings across 8 standardized categories, each on a 1-10 scale:
| Rating Category | What It Measures |
|---|---|
| Likelihood to Recommend | Overall satisfaction and advocacy willingness |
| Likelihood to Renew | Retention risk signal |
| Usability | Ease of use, learning curve, interface quality |
| Performance | Speed, reliability, uptime |
| Support Rating | Customer support quality and responsiveness |
| Online Training | Quality of self-service learning resources |
| Implementation Rating | Deployment complexity and vendor assistance |
| Scalability | Ability to grow with the organization |
These 8 dimensions create a multi-axis evaluation that far exceeds the single 5-star rating on Google or the 2-3 dimensions on G2. For vendors, this means you can identify exact weak points (e.g., strong on Usability but weak on Scalability) rather than working with a single aggregate score.
Alternatives Considered
This is TrustRadius's most strategically valuable data field. Reviewers list which other products they evaluated before choosing the reviewed product. This creates a competitive intelligence dataset that is nearly impossible to replicate through other means.
Analysis of the Alternatives Considered field reveals:
- Who your real competitors are — Not who you think competes with you, but who buyers actually compare you against
- Win/loss patterns — When reviewers chose your product over alternatives, their Pros explain why. When they chose an alternative, their reviews of that product explain why you lost.
- Market perception clusters — Which products buyers group together reveals how the market perceives category boundaries
ROI Assessment
TrustRadius asks reviewers to assess the return on investment they have experienced. Responses typically fall into categories: significant positive ROI, moderate positive ROI, break-even, and negative ROI. This data is directly usable in sales enablement — quoting verified users who report significant ROI is more credible than vendor-generated case studies.
Best For / Not Best For
Reviewers specify which use cases the product is best suited for and which it is not. This creates a use-case fit matrix directly from verified user experience:
| Best For | Not Best For |
|---|---|
| Mid-market companies (100-1000 employees) | Enterprise with 10,000+ users |
| Marketing teams managing content workflows | Engineering teams needing code-level customization |
| Companies with Salesforce as CRM | Companies using HubSpot (integration limitations) |
| Subscription-based businesses | One-time purchase/e-commerce |
This data is invaluable for sales teams qualifying prospects and for marketing teams refining their ideal customer profile.
TrustRadius vs. G2 vs. Capterra: Platform Differences
Understanding how TrustRadius compares to other B2B review platforms helps you interpret its data correctly and build a cross-platform analysis strategy.
Review Quality and Depth
| Dimension | TrustRadius | G2 | Capterra |
|---|---|---|---|
| Average review length | 300-500 words | 150-250 words | 100-200 words |
| Verification level | LinkedIn + email + screening | Email verification | Email verification |
| Rating dimensions | 8 categories (1-10 scale) | 6 categories (5-star) | 5 categories (5-star) |
| Alternatives data | Yes (explicitly requested) | Sometimes mentioned in text | Rarely captured |
| ROI assessment | Structured field | Not structured | Not structured |
| Vendor influence on placement | None (no pay-to-play) | Significant (paid placement) | Significant (paid placement) |
Review Volume Comparison
G2 has significantly more reviews than TrustRadius for most products. A product might have 2,000 G2 reviews but only 200 on TrustRadius. This volume difference means:
- G2 is better for statistical trends — More data points enable more reliable trend analysis
- TrustRadius is better for qualitative depth — Each review contains more information
- G2 scores are more susceptible to vendor manipulation — Through solicitation campaigns and paid placement
- TrustRadius scores are more resistant to gaming — The verification and no-pay model makes manipulation harder
Buyer Trust and Decision Influence
Enterprise buyers (deals >$50K) disproportionately trust TrustRadius. Mid-market buyers (deals $10K-$50K) tend to use G2 and TrustRadius equally. SMB buyers (<$10K) primarily use G2 and Capterra.
This means TrustRadius reviews influence the highest-value deals. A negative trend on TrustRadius has a larger revenue impact per deal than a similar trend on G2, even though G2 reaches more total buyers.
Using TrustRadius for Enterprise Sales Enablement
TrustRadius reviews are a sales asset. Here is how to extract and deploy them.
Building the Proof Point Library
Systematically extract quotes from TrustRadius reviews that address common sales objections:
Objection: "Is this product reliable at enterprise scale?" > Extract Scalability ratings and Pros mentioning large deployments. Example: "We deployed across 3,500 users in 12 countries. The platform handles peak loads without degradation." — Verified user, Fortune 500 company.
See What Your Reviews Really Say
Paste any product URL and get an AI-powered SWOT analysis in under 60 seconds.
Try It Free →Objection: "What's the implementation timeline?" > Extract Implementation ratings and specific timeline mentions. Example: "Full implementation took 8 weeks including data migration. TrustRadius rating: 8/10 for implementation."
Objection: "How does this compare to [competitor]?" > Extract Alternatives Considered mentions. Example: "We evaluated [Competitor A] and [Competitor B]. We chose [Your Product] because of superior API flexibility and lower total cost of ownership."
ROI Narratives for Enterprise Buyers
TrustRadius ROI assessments can be aggregated into compelling data points:
- "83% of verified reviewers on TrustRadius report positive ROI within the first year"
- "The average TrustRadius reviewer rates our implementation experience 8.2 out of 10"
- "Among reviewers who considered [Competitor], 71% chose our product — citing [top 3 reasons]"
These data points carry more weight than internal case studies because they come from verified, independent users on a no-pay-to-play platform.
Competitive Analysis From the "Alternatives Considered" Field
The Alternatives Considered data on TrustRadius is one of the most underutilized competitive intelligence sources in B2B software.
Mapping Your True Competitive Landscape
Pull the Alternatives Considered data from your product's TrustRadius reviews and count frequency:
| Alternative Considered | Frequency | Win Rate (chose you) | Loss Signals |
|---|---|---|---|
| Competitor A | 45% of reviews | 72% | Price sensitivity at scale |
| Competitor B | 38% of reviews | 58% | Feature parity gaps in reporting |
| Competitor C | 22% of reviews | 81% | Competitor C weak on integration |
| Competitor D | 15% of reviews | 44% | Competitor D stronger for enterprise |
| Custom/In-House | 12% of reviews | 67% | Build vs. buy hesitation |
This matrix reveals: - Your actual competitive set — Competitor D at 15% but only 44% win rate may be a bigger strategic threat than Competitor A at 45% but 72% win rate - Why you win — Cross-reference with Pros sections of reviewers who considered each alternative - Why you lose — Cross-reference with the competitor's TrustRadius reviews from users who considered your product
Reverse-Engineering Competitor Weaknesses
Read TrustRadius reviews of your competitors — specifically the Cons sections and low rating categories. Build a competitor weakness map:
- Competitor A: Cons cluster around "pricing becomes unreasonable at scale" (34% of Cons mention pricing) and "poor customer support response times" (28%)
- Competitor B: Cons cluster around "steep learning curve" (41%) and "limited API capabilities" (25%)
- Competitor C: Cons cluster around "performance degrades with large datasets" (37%) and "poor mobile experience" (22%)
These weaknesses become your competitive differentiation points. If Competitor A's users consistently cite pricing at scale, your sales team should proactively address total cost of ownership in competitive deals.
How Product Teams Use TrustRadius Insights
Product managers building enterprise software should treat TrustRadius as a structured feedback channel. Here is a practical framework.
Feature Gap Prioritization
Extract all feature-related Cons mentions and rank by frequency:
- "No native [X] integration" — mentioned in 34% of Cons
- "Reporting customization is limited" — mentioned in 28% of Cons
- "Mobile app lacks feature parity" — mentioned in 22% of Cons
- "Admin console needs redesign" — mentioned in 19% of Cons
- "Bulk operations are slow" — mentioned in 15% of Cons
Cross-reference with the "Best For / Not Best For" section. If "not best for large datasets" appears frequently alongside "bulk operations are slow" in Cons, these are correlated issues that a single engineering investment could address.
Rating Category Trend Analysis
Track your 8 TrustRadius rating categories quarterly:
| Category | Q1 2025 | Q2 2025 | Q3 2025 | Q4 2025 | Trend |
|---|---|---|---|---|---|
| Usability | 8.1 | 8.3 | 8.4 | 8.5 | Improving |
| Performance | 7.8 | 7.6 | 7.2 | 6.9 | Declining |
| Support | 8.5 | 8.4 | 8.3 | 8.1 | Slight decline |
| Scalability | 6.5 | 6.7 | 6.8 | 7.0 | Improving |
| Implementation | 7.9 | 8.0 | 8.1 | 8.2 | Improving |
This trend data identifies where investments are paying off (Usability, Scalability improvements) and where new problems are emerging (Performance decline — likely correlated with the "bulk operations" Cons).
Renewal Risk Signals
The "Likelihood to Renew" rating is a direct churn risk indicator. Segment reviewers by their renewal likelihood and analyze what differentiates detractors from promoters:
- High renewal likelihood (9-10): What do they consistently praise? This is your retention moat.
- Medium renewal likelihood (6-8): What are their Cons? These are fixable issues that could move them to high loyalty.
- Low renewal likelihood (1-5): What went wrong? These reviews contain your most critical operational failures.
"TrustRadius's Likelihood to Renew rating is the closest thing to a publicly available churn prediction model. If your average renewal score drops below 7, you have a retention crisis — whether your NPS score shows it or not."
Sentimyne for TrustRadius Analysis
Manually analyzing TrustRadius reviews is feasible for products with fewer than 50 reviews. For larger portfolios or competitive analysis across multiple products, automated analysis saves substantial time.
Sentimyne processes product pages from TrustRadius alongside 12+ other review platforms, generating cross-platform SWOT analysis in approximately 60 seconds. For B2B software vendors, this capability answers critical questions:
Cross-Platform Sentiment Comparison
Does your TrustRadius sentiment match your G2 sentiment? Discrepancies are diagnostic:
- TrustRadius more positive than G2 — Your verified enterprise users are happier than your broader user base; you may have an SMB experience gap
- TrustRadius more negative than G2 — Enterprise-specific issues (scalability, security, compliance) are dragging your score; product investment should target enterprise requirements
- Ratings aligned — Consistent experience across customer segments; focus on the specific themes each platform surfaces
Multi-Platform SWOT for Board Reporting
Enterprise product leaders need to present customer sentiment data to executive leadership. Sentimyne's SWOT format — synthesizing strengths, weaknesses, opportunities, and threats from verified reviews across platforms — provides a board-ready summary that individual review platform dashboards cannot match.
The free tier at 2 analyses per month supports initial competitive benchmarking. The Pro plan at $29/month enables continuous monitoring — particularly valuable for tracking how product releases and operational changes affect review sentiment across all platforms simultaneously.
Building a TrustRadius Review Analysis Program
For enterprise software vendors, TrustRadius review analysis should be a formal program, not an ad hoc activity.
Monthly activities: - Read all new TrustRadius reviews (both your product and top 3 competitors) - Respond to every review thoughtfully (TrustRadius allows vendor responses) - Update the competitive intelligence database with new Alternatives Considered data - Extract new proof points for sales enablement
Quarterly activities: - Run Sentimyne cross-platform analysis to track rating trends - Update the feature gap prioritization matrix based on new Cons data - Brief the product team on emerging themes and rating category changes - Refresh the competitive weakness map
Annually: - Full competitive audit across all TrustRadius profiles in your category - Benchmark your 8 rating categories against category averages - Assess whether your "Best For / Not Best For" profile matches your ICP - Present year-over-year trends to executive leadership
Frequently Asked Questions
How many TrustRadius reviews does my product need for meaningful analysis?
TrustRadius reviews are individually richer than reviews on most other platforms, so fewer reviews are needed for theme identification. With 20-25 reviews, you can reliably identify your top 3 strengths and weaknesses. With 50+ reviews, trend analysis and rating category benchmarking become statistically meaningful. For competitive analysis using Alternatives Considered data, you need at least 30 reviews that mention specific competitors to draw reliable conclusions about win/loss patterns. If your product has fewer than 20 TrustRadius reviews, prioritize generating more reviews — the platform's credibility makes even a modest number strategically valuable.
How does TrustRadius's no-pay-to-play model affect review solicitation?
TrustRadius does not allow vendors to incentivize reviews through the platform, but it does provide a review generation program. Vendors can invite customers to leave reviews through TrustRadius's official channels — the platform sends the invitation, verifies the reviewer, and screens the review. Importantly, unlike some platforms, TrustRadius does not allow vendors to cherry-pick which reviews are published. All verified reviews that meet quality standards appear publicly. This means your review generation efforts should focus on inviting customers broadly, not selectively targeting happy customers — TrustRadius's model ensures the outcome reflects genuine sentiment.
How should I handle negative TrustRadius reviews?
Respond promptly, professionally, and specifically. Because TrustRadius readers are enterprise buyers making high-stakes decisions, your response to negative reviews is heavily scrutinized. Acknowledge the specific issues raised. Explain what you are doing to address them. If the issue has been resolved since the review was posted, say so with specifics. Avoid generic responses — enterprise buyers can spot templated responses immediately, and they erode trust. If the reviewer raises a legitimate product gap, own it and share your roadmap timeline. Authenticity outperforms defensiveness every time on this platform.
Can I see which competitors my reviewers considered before choosing my product?
Yes. TrustRadius explicitly asks reviewers to list which alternatives they evaluated. This data appears in the individual review and is aggregated in TrustRadius's comparison pages. You can see not only which competitors were considered but also, by reading the review context, why the reviewer ultimately chose your product. For competitors' reviews, you can see reviews from users who considered your product but chose the competitor instead — these are particularly valuable because they reveal why you lost. This competitive intelligence is unique to TrustRadius among major review platforms.
Should I prioritize TrustRadius over G2 for review generation?
It depends on your market segment. If you primarily sell to enterprise buyers (deals >$50K, 6+ month sales cycles, buying committees), TrustRadius reviews have higher per-review value because they influence the highest-value decisions and carry maximum credibility. If your primary market is SMB or mid-market, G2's larger audience and higher traffic make it a better volume investment. The ideal approach is both — generate TrustRadius reviews for enterprise credibility and G2 reviews for mid-market visibility. Use Sentimyne to track how your sentiment compares across both platforms and identify segment-specific issues.
Ready to try AI-powered review analysis?
Get 2 free SWOT reports per month. No credit card required.
Start FreeRelated Articles
An in-depth comparison of Capterra, TrustRadius, and G2 across review format, audience demographics, vendor pricing, buyer influence, and SEO value. Learn which platform matters most for your software category and how to monitor all three with a unified review analysis strategy.
Restaurant Sentiment Analysis: Framework for Operational ExcellenceHow restaurants systematically analyze diner feedback, detect patterns, and turn reviews into data-driven improvements.
Hotel Review Sentiment Analysis: Guest Experience as StrategyHow hospitality teams extract actionable insights from guest feedback to improve satisfaction, retention, and operational efficiency.