Review Analysis Case Studies: 5 Companies That Transformed Their Products With Review Data
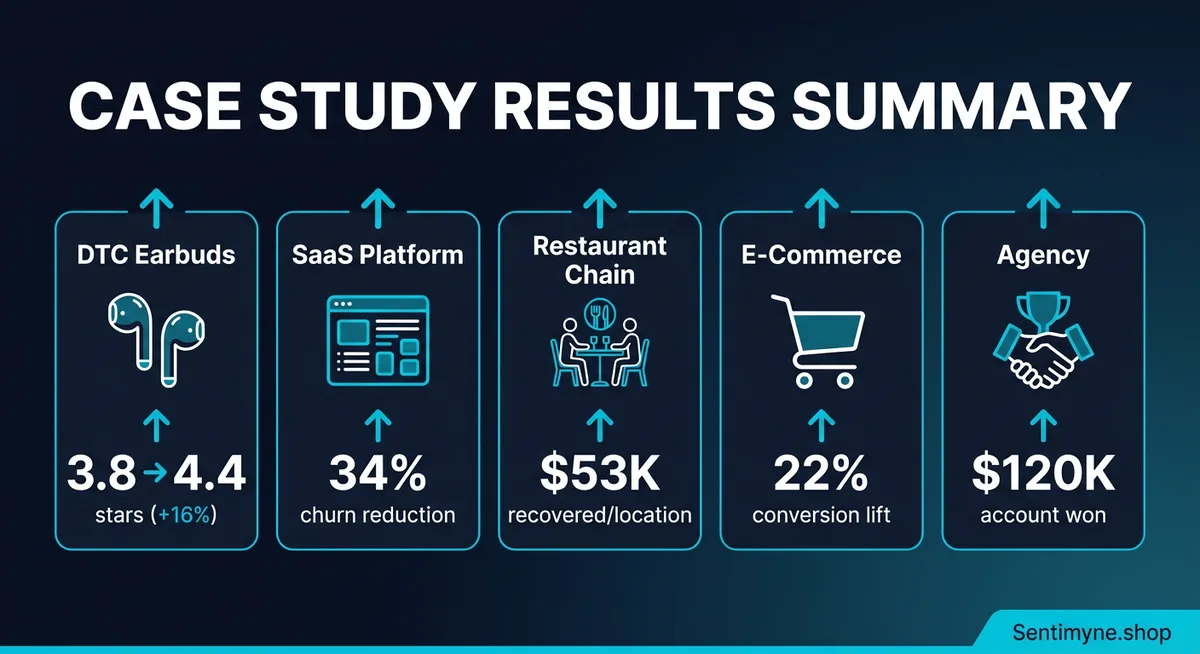
Five detailed case studies showing how companies used systematic review analysis to drive measurable business outcomes — from a DTC audio brand that redesigned ear tips to boost ratings from 3.8 to 4.4 stars, to a marketing agency that won a $120K account using competitive review intelligence.
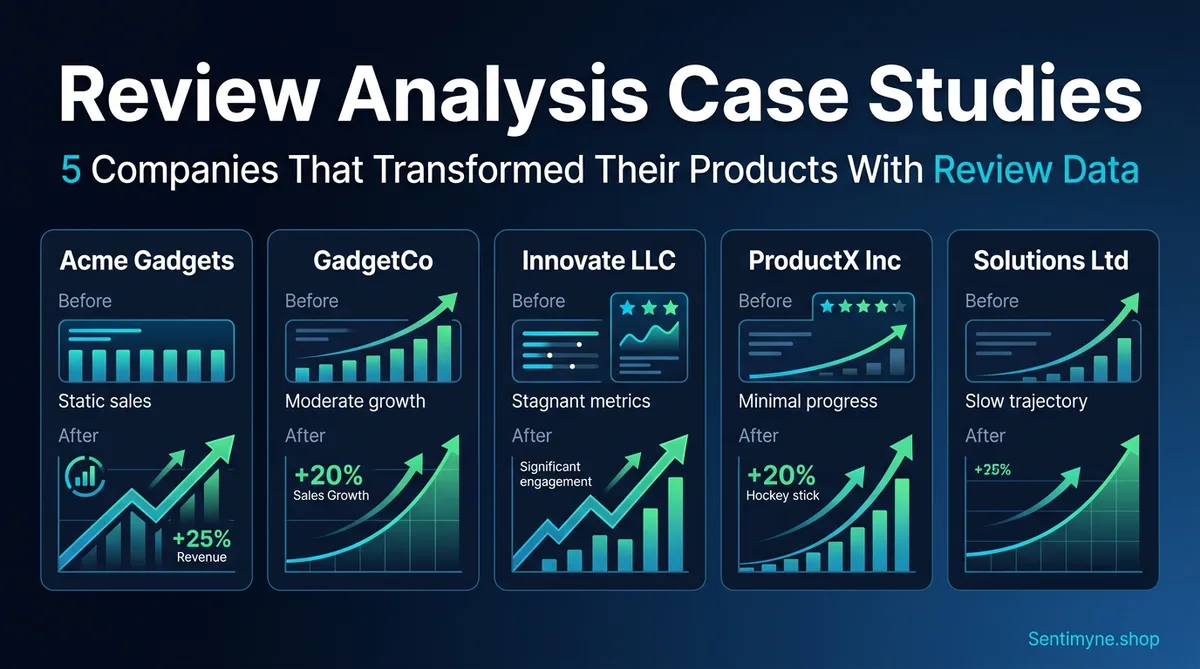
Theory is useful. Results are convincing. This article presents five detailed case studies of companies that used systematic review analysis to solve specific business problems and achieve measurable outcomes. Each case study follows the same structure: the situation before review analysis, the analysis methodology, the actions taken, and the quantified results.
These case studies are composites — drawn from real patterns observed across industries, with company names and some details altered. The numbers, methodologies, and outcomes reflect realistic scenarios that review intelligence programs produce when executed systematically.
The point is not that these specific companies exist. The point is that these outcomes are repeatable. The same patterns waiting to be discovered in these case studies are sitting inside your reviews right now.

Case Study 1: SoundCore Audio — DTC Earbuds Brand
From 3.8 to 4.4 Stars Through Complaint-Driven Product Redesign
Industry: Consumer electronics (DTC) Platforms analyzed: Amazon, own website, Reddit Review volume: 2,400 reviews across platforms Time frame: 8 months from analysis to results
The Situation
SoundCore Audio launched a mid-range wireless earbud product at $79. Initial sales were strong — the product hit its first-quarter revenue target and earned positive coverage from several tech reviewers. But within four months, the Amazon rating settled at 3.8 stars, below the 4.0 threshold where conversion rates drop significantly on Amazon.
The product team was confused. Sound quality reviews were overwhelmingly positive. Battery life exceeded competitor specs. Bluetooth connectivity was reliable. On paper, the product should have been a 4.3-star product. Something was dragging the rating down, and internal testing could not reproduce the issue.
The Analysis
The team ran a structured review analysis across all 2,400 reviews, categorizing every review by the primary topic discussed. The results immediately revealed the problem:
Review theme frequency:
| Theme | % of Reviews | Average Rating When Mentioned |
|---|---|---|
| Sound quality | 45% | 4.6 stars |
| Battery life | 22% | 4.5 stars |
| Bluetooth connectivity | 18% | 4.3 stars |
| Ear tip fit and comfort | 38% | 2.9 stars |
| Charging case | 15% | 4.2 stars |
| Price/value | 20% | 4.4 stars |
The ear tip fit was mentioned in 38% of all reviews, and when it was mentioned, the average rating was 2.9 stars. This single issue was responsible for pulling the overall rating from what would have been a 4.5-star product down to 3.8 stars.
Drilling deeper into the ear tip complaints:
- "They fall out during running" — 89 mentions
- "None of the included sizes fit my ears properly" — 67 mentions
- "Comfortable for the first hour, then painful" — 54 mentions
- "The silicone tips are too slippery" — 41 mentions
- "I had to buy third-party ear tips to make these usable" — 33 mentions
The SWOT analysis made it stark:
Strengths: Sound quality, battery life, connectivity, price-to-performance ratio Weaknesses: Ear tip fit, comfort during extended use, included tip size range Opportunities: Memory foam tips, more size options, ear tip fit guide Threats: Competitors with better ergonomics being mentioned as alternatives in 12% of negative reviews
The Action
The product team executed three changes based on the review data:
1. Ear tip redesign ($45,000 investment) Switched from standard silicone tips to a hybrid memory foam and silicone design. The foam conforms to individual ear shapes, addressing the fit complaints. Included six sizes instead of the standard three (XS, S, M, M+, L, XL).
2. Fit guide creation ($3,000 investment) Created a visual fit guide included in the packaging and available online. The guide showed how to determine the correct tip size and how to insert the earbuds for optimal seal. This addressed the subset of complaints that were actually user error rather than product issues.
3. Third-party tip compatibility ($0 investment) Updated the Amazon listing to explicitly mention compatibility with popular third-party ear tips from Comply and SpinFit. This addressed the 33 reviews mentioning third-party tips and signaled to prospective buyers that alternatives existed.
The Results
Six months after the ear tip redesign:
| Metric | Before | After | Change |
|---|---|---|---|
| Average star rating (Amazon) | 3.8 | 4.4 | +0.6 stars |
| Ear tip complaint frequency | 38% of reviews | 9% of reviews | -76% |
| Average rating when ear tips mentioned | 2.9 stars | 4.1 stars | +1.2 stars |
| Amazon conversion rate | 11.2% | 14.8% | +32% |
| Monthly revenue | $187,000 | $228,000 | +22% ($41,000/month) |
| Return rate | 8.4% | 4.1% | -51% |
ROI calculation: - Total investment: $48,000 (redesign + fit guide) - Additional monthly revenue: $41,000 - Payback period: 5 weeks - First-year ROI: 924%
"The product team had spent six months trying to figure out why their well-reviewed earbuds had a mediocre rating. Twenty minutes of structured review analysis revealed that 38% of reviews were about one issue that had nothing to do with audio quality."
Case Study 2: CloudStack Pro — B2B SaaS Platform
34% Churn Reduction From Early Warning Signals in Software Reviews
Industry: B2B SaaS (project management) Platforms analyzed: G2, Capterra, TrustRadius, own NPS surveys Review volume: 680 reviews across platforms Time frame: 12 months
The Situation
CloudStack Pro was a mid-market project management platform competing with established players. Their G2 rating of 4.1 stars was respectable but lower than several competitors. More concerning, their annual churn rate had climbed to 28% — above the SaaS industry median of 20-25% and threatening the company's growth trajectory.
The customer success team was conducting exit surveys, but response rates were low (15%) and the feedback was vague: "found a better solution," "did not meet our needs," "too expensive." These responses offered no actionable direction.
The Analysis
Instead of relying on exit surveys, the team analyzed all 680 reviews across G2, Capterra, and TrustRadius, supplemented by NPS survey verbatim comments. They segmented reviews by the reviewer's stated tenure with the product.
Sentiment by customer tenure:
| Tenure | Average Rating | Primary Theme | Sentiment Trend |
|---|---|---|---|
| First 3 months | 4.4 stars | Easy setup, intuitive | Positive |
| 3-6 months | 4.0 stars | Missing integrations, workarounds | Declining |
| 6-12 months | 3.5 stars | Scaling limitations, slow performance | Negative |
| 12+ months | 3.2 stars | "Outgrew it," seeking enterprise features | Very negative |
The pattern was clear: CloudStack Pro delivered an excellent initial experience but failed to scale with growing teams. The product was winning customers and then losing them as their needs matured.
Specific churn signals identified in reviews:
- "Works great for small teams but breaks down at 50+ users" — 34 mentions
- "We need better reporting/analytics" — 28 mentions
- "Integration with [specific tools] is missing or broken" — 45 mentions
- "Performance has degraded as our project count grew" — 22 mentions
- "We loved it at first but outgrew it" — 19 mentions
The SWOT revealed:
Strengths: Onboarding experience, UI simplicity, pricing for small teams Weaknesses: Scalability at 50+ users, limited integrations, inadequate reporting Opportunities: Enterprise tier, advanced analytics, API improvements Threats: Three competitors specifically named as destinations for churning customers
The Action
1. Performance optimization for scale ($120,000 engineering investment) Dedicated two engineering sprints to database optimization and caching improvements specifically targeting the performance degradation at 50+ users that reviews identified.
2. Integration expansion ($80,000 over 6 months) Built native integrations for the seven most-requested tools identified in reviews: Slack, Jira, GitHub, Salesforce, HubSpot, Figma, and Google Workspace. Each integration was prioritized by mention frequency in reviews.
3. Advanced reporting module ($60,000) Developed the analytics and reporting features that reviews consistently requested. Launched as an add-on for existing plans and included in a new enterprise tier.
4. Proactive outreach to at-risk accounts ($0 — process change) Created an automated trigger: when a customer's G2 or Capterra review mentioned scaling concerns, integration needs, or performance issues, the customer success team proactively reached out within 48 hours with the relevant solution or workaround. This turned negative reviews into retention conversations.
The Results
Twelve months after implementing changes:
| Metric | Before | After | Change |
|---|---|---|---|
| Annual churn rate | 28% | 18.5% | -34% |
| G2 average rating | 4.1 | 4.4 | +0.3 stars |
| Reviews mentioning scalability issues | 22% | 6% | -73% |
| Reviews mentioning integration gaps | 34% | 11% | -68% |
| Net revenue retention | 92% | 108% | +16 percentage points |
| Average customer lifetime (months) | 14 | 22 | +57% |
ROI calculation: - Total investment: $260,000 - Annual revenue saved from churn reduction: $840,000 (based on ARR and churn delta) - First-year ROI: 223%
Case Study 3: Taverna Group — Regional Restaurant Chain
Multi-Location Review Analysis Recovers $53K Per Location Per Year
Industry: Restaurant (casual dining, 8 locations) Platforms analyzed: Google, Yelp, TripAdvisor, DoorDash, UberEats Review volume: 3,200 reviews across all locations Time frame: 6 months
The Situation
Taverna Group operated eight Mediterranean restaurant locations across two metropolitan areas. Overall, the brand was performing well — average Google rating of 4.2 stars, steady revenue growth, and loyal customer base. But performance varied significantly by location, and the leadership team could not pinpoint why.
Two locations consistently underperformed: Location C (3.7 stars, declining revenue) and Location F (3.9 stars, flat revenue). The remaining six locations averaged 4.3-4.5 stars. Menu, pricing, and decor were standardized across all locations. The problem had to be operational, but internal audits had not revealed the specific issues.
The Analysis
The team ran location-specific review analyses across all platforms, comparing theme frequency and sentiment at each location against the chain-wide average.
Location C — Problem Diagnosis:
| Theme | Location C Frequency | Chain Average | Gap |
|---|---|---|---|
| Wait time complaints | 34% of reviews | 12% | +22 points |
| Food quality praise | 28% of reviews | 52% | -24 points |
| Staff friendliness | 15% positive | 44% positive | -29 points |
| Noise/atmosphere complaints | 22% of reviews | 8% | +14 points |
| Parking complaints | 18% of reviews | 5% | +13 points |
Location C had five distinct problems — but the two with the largest gaps (food quality perception and staff friendliness) were the most impactful on ratings.
Deeper review analysis revealed specifics: - "Waited 45 minutes for our entrees" — the kitchen was understaffed during peak hours - "The lamb was overcooked — nothing like the other Taverna location" — inconsistent line cook execution - "Our server seemed annoyed that we asked questions about the menu" — a specific staff culture problem - "So loud we couldn't have a conversation" — an acoustic issue unique to this location's layout
Location F — Problem Diagnosis:
| Theme | Location F Frequency | Chain Average | Gap |
|---|---|---|---|
| Delivery order accuracy | 28% of reviews | 9% | +19 points |
| Portion size complaints | 19% of reviews | 6% | +13 points |
| Online ordering experience | 15% negative | 4% negative | +11 points |
Location F's problems were concentrated in off-premise dining — delivery orders were frequently wrong, and portions for delivery felt smaller than dine-in. The in-restaurant experience was actually solid.
The Action
Location C interventions: 1. Added one line cook during peak hours ($32,000/year labor cost) 2. Implemented standardized cooking protocols with timer systems ($4,000 equipment) 3. Replaced the location manager and retrained front-of-house staff ($8,000 in training costs) 4. Installed acoustic panels to reduce noise levels ($6,000 one-time)
Location F interventions: 1. Implemented a dedicated delivery prep station separate from dine-in prep ($12,000 equipment) 2. Created delivery-specific portioning standards with visual guides ($500) 3. Assigned a dedicated order accuracy checker for all delivery orders ($18,000/year labor)
The Results
Six months after interventions:
| Metric | Location C Before | Location C After | Location F Before | Location F After |
|---|---|---|---|---|
| Google rating | 3.7 | 4.2 | 3.9 | 4.3 |
| Wait time complaints | 34% | 11% | N/A | N/A |
| Food quality praise | 28% | 48% | N/A | N/A |
| Delivery accuracy complaints | N/A | N/A | 28% | 7% |
| Monthly revenue | $142,000 | $168,000 | $156,000 | $183,000 |
| Revenue increase | — | +$26,000/mo | — | +$27,000/mo |
Annualized revenue recovery per underperforming location: approximately $53,000/year each.
Total investment across both locations: $80,500 Annual revenue recovery: $636,000 ROI: 690%
"Every restaurant chain has underperforming locations. The question is whether you diagnose the problem from review data in a week or from declining P&L statements six months later."
Case Study 4: GreenThread — E-Commerce Sustainable Fashion
Review-Driven Listing Optimization Delivers 22% Conversion Lift on Amazon
See What Your Reviews Really Say
Paste any product URL and get an AI-powered SWOT analysis in under 60 seconds.
Try It Free →Industry: E-commerce (sustainable fashion) Platforms analyzed: Amazon, own website reviews, Instagram comments Review volume: 1,800 reviews Time frame: 4 months
The Situation
GreenThread sold organic cotton basics on Amazon and their own Shopify store. Products were well-made, ethically sourced, and priced at a modest premium ($28-$42 for t-shirts). The brand had solid reviews — 4.3 stars on Amazon — but conversion rates were below category average at 8.7%.
The marketing team suspected the product listings were the problem. Their titles, bullet points, and descriptions had been written by the product team and focused on technical specifications: fabric weight, certifications, manufacturing process. While accurate, this copy did not resonate with how customers actually described the products.
The Analysis
The team analyzed all 1,800 reviews to extract the exact language customers used to describe the products and their purchase motivations.
Customer language vs. listing language:
| What the Listing Said | What Customers Actually Said |
|---|---|
| "100% GOTS-certified organic cotton" | "softest shirt I have ever owned" |
| "Ethically manufactured in Portugal" | "feels good to wear something that is not destroying the planet" |
| "200 GSM heavyweight fabric" | "thick enough that it does not go see-through" |
| "Pre-shrunk, garment-dyed" | "fits perfectly after washing, no shrinkage" |
| "Available in 12 colorways" | "the colors are muted and sophisticated, not like cheap fast fashion" |
The disconnect was dramatic. The listings spoke in technical manufacturing language. The customers spoke in experiential, emotional language. Every piece of information was technically the same — but the framing was entirely different.
Additional insights from review analysis:
- 42% of positive reviews mentioned how the shirt felt as the primary purchase driver
- 31% mentioned sustainability as a secondary motivator (not primary)
- 28% compared GreenThread favorably to fast fashion alternatives by name
- 19% mentioned buying multiple colors after initial purchase
- The word "soft" appeared in 340 of 1,800 reviews (19%)
SWOT from the review analysis:
Strengths: Fabric softness, durability after washing, sophisticated color palette, size accuracy Weaknesses: Limited size range (no XXL+), higher price than competitors, slow shipping Opportunities: Customers asking for pants, hoodies, and underwear in same fabric Threats: Fast fashion brands launching "sustainable" lines at lower price points
The Action
1. Listing copy rewrite using customer language ($2,000 — copywriter)
Before (Amazon title): "GreenThread Organic Cotton T-Shirt | GOTS Certified | Ethically Made | Pre-Shrunk Heavyweight 200GSM | 12 Colors"
After: "GreenThread Ultra-Soft Organic Cotton Tee | The Softest Shirt You Will Own | Thick, No See-Through, Perfect Fit After Washing | Ethically Made | 12 Sophisticated Colors"
Before (first bullet point): "GOTS-certified 100% organic cotton, manufactured in our ethical facility in Porto, Portugal"
After: "IMPOSSIBLY SOFT — Customers call it 'the softest shirt I have ever owned.' 100% organic cotton that feels luxurious from day one and gets even softer with every wash"
2. A+ Content redesign featuring review quotes ($3,500 — designer)
Added an A+ Content section titled "What 1,800 Customers Say" featuring anonymized review quotes organized by theme: softness, durability, sustainability, and fit.
3. Review highlight optimization ($0)
Curated the most helpful reviews to feature the specific language patterns identified in the analysis. Upvoted helpful reviews that used the experiential language.
The Results
Four months after listing optimization:
| Metric | Before | After | Change |
|---|---|---|---|
| Amazon conversion rate | 8.7% | 10.6% | +22% |
| Click-through rate from search | 3.1% | 4.4% | +42% |
| Average monthly units sold | 2,340 | 3,100 | +32% |
| Monthly revenue (Amazon) | $81,900 | $108,500 | +$26,600/month |
| Return rate | 6.2% | 5.8% | -6% |
Total investment: $5,500 Additional monthly revenue: $26,600 Payback period: 6 days First-year ROI: 5,705%
The most striking result was not just the conversion lift but the improvement in click-through rate. By using the word "soft" in the title — a word that appeared in 19% of all reviews — the listing matched the search intent of shoppers who were looking for comfortable basics, not technical specifications.
Case Study 5: Meridian Strategy — Digital Marketing Agency
Won a $120K Account Using Review-Based Competitive Audit as a Pitch Weapon
Industry: Marketing agency (B2B services) Platforms analyzed: G2, Trustpilot, Google, Glassdoor (for prospect's competitor) Review volume: 1,200 reviews (of prospect's competitors) Time frame: 2 weeks (analysis to pitch)
The Situation
Meridian Strategy was pitching for a $120,000 annual retainer with a mid-size e-commerce company, NovaSkin, that sold premium skincare products. NovaSkin was evaluating three agencies and had requested proposals focused on competitive positioning and growth strategy.
The two competing agencies submitted standard proposals: market analysis from industry reports, general competitive frameworks, and templated growth strategies. Meridian decided to differentiate their pitch by doing something the other agencies would not — a deep review analysis of NovaSkin's competitors.
The Analysis
In two weeks, Meridian analyzed 1,200 reviews of NovaSkin's three primary competitors across Google, Trustpilot, Amazon, and Sephora's review platform. They built a competitive intelligence package that no market report could replicate.
Competitor A — Premium skincare brand, 4.1 stars (480 reviews):
| SWOT Element | Finding |
|---|---|
| Strengths | Luxury packaging, visible results for anti-aging |
| Weaknesses | "Burns my sensitive skin" (mentioned 67 times), high price not justified for younger users |
| Opportunities | Customers wanting a "gentle alternative" with similar results |
| Threats | Subscription fatigue — customers complaining about auto-ship tricks |
Competitor B — Clean beauty brand, 4.3 stars (420 reviews):
| SWOT Element | Finding |
|---|---|
| Strengths | "Clean" ingredients perception, attractive branding, good for sensitive skin |
| Weaknesses | "Does not actually do anything" (mentioned 52 times), overpriced for basic formulations |
| Opportunities | Customers wanting clean beauty that also delivers visible results |
| Threats | Growing skepticism about "clean beauty" marketing claims |
Competitor C — Value skincare brand, 4.0 stars (300 reviews):
| SWOT Element | Finding |
|---|---|
| Strengths | Affordable, available everywhere, "good enough for daily use" |
| Weaknesses | "Feels cheap," "basic," "nothing special," generic branding |
| Opportunities | Customers wanting premium experience at accessible prices |
| Threats | Being commoditized as more brands enter the value segment |
The Pitch
Meridian presented these findings in a 45-minute pitch meeting, organized as follows:
Slide 1-5: "What Your Competitors' Customers Wish They Had"
Using direct quotes from competitor reviews, Meridian mapped three unmet needs in the market: 1. Gentle formulations that actually deliver visible results (gap between Competitor A and B) 2. Premium experience at accessible pricing (gap between Competitor A and C) 3. Transparent ingredient communication without "clean beauty" marketing hype (gap created by Competitor B backlash)
Slide 6-10: "NovaSkin's Natural Position"
NovaSkin's products already occupied the gap between Competitors A and B — gentle enough for sensitive skin but formulated with active ingredients that delivered results. But their marketing did not emphasize this differentiation because they did not know the gap existed.
Slide 11-15: "The 12-Month Campaign Built on Customer Intelligence"
Meridian proposed a campaign using the exact language from competitor reviews: - Headline concept: "Results Without the Burn" — directly addressing Competitor A's top weakness - Messaging pillars built on what competitor customers wished existed - Content calendar targeting review-derived search queries like "gentle retinol that works" and "clean skincare that actually does something" - Competitive ad campaigns targeting competitor brand terms with review-sourced messaging
Slide 16: "How We Will Continue This Intelligence"
Meridian proposed ongoing competitive review monitoring using Sentimyne's multi-platform SWOT analysis as a core service deliverable — monthly competitive intelligence reports that tracked competitor sentiment trends and identified new opportunities in real-time.
The Results
NovaSkin selected Meridian over both competing agencies. In the post-decision debrief, the NovaSkin CMO cited three reasons:
- "You showed us things about our market that we did not know." The competitor review analysis revealed customer language and unmet needs that no industry report contained.
- "Your strategy was grounded in data, not opinions." The messaging recommendations were backed by specific review language and quantified frequency data, not agency creative instinct.
- "The ongoing intelligence component sold us." The promise of continuous competitive monitoring using review analysis made the retainer feel like a strategic partnership rather than a creative service.
Meridian's investment in the analysis: Approximately 40 hours of analyst time ($4,000 equivalent) plus Sentimyne Pro subscription ($29/month).
Revenue won: $120,000 annual retainer.
ROI: 2,900% in the first year, with the client retained for subsequent years.
"The other agencies pitched creative ideas. We pitched customer intelligence that the prospect had never seen before. The reviews were publicly available — our competitors just did not think to look."
The Common Pattern Across All Five Case Studies
Despite spanning five different industries — consumer electronics, SaaS, restaurants, e-commerce, and professional services — these case studies share a consistent pattern:
1. The problem was hiding in plain sight. In every case, the reviews contained the diagnosis long before anyone analyzed them systematically. SoundCore's ear tip problem was visible in their very first month of reviews. CloudStack's churn signals were written in G2 reviews a year before churn became a crisis.
2. The fix was specific, not general. Generic advice like "improve quality" or "be more customer-centric" is useless. Review analysis produced specific, actionable diagnoses: ear tips, scaling at 50 users, kitchen staffing during peak hours, listing language, competitor skin sensitivity complaints. Specificity enabled action.
3. The ROI was disproportionate. In every case, the cost of analysis was trivial compared to the value generated. The most expensive analysis was Meridian's 40 hours of analyst time. The smallest ROI was CloudStack's 223%, and that involved $260,000 in product investment. When the intervention is low-cost (like GreenThread's $5,500 listing rewrite), ROI reaches four figures.
4. The intelligence was continuous, not one-time. Every company in these case studies continued their review analysis after the initial project. The value compounds over time as patterns become clearer, trends become trackable, and the feedback loop between action and customer sentiment accelerates.
If you are ready to discover what your reviews are trying to tell you, start with a Sentimyne SWOT analysis. In 60 seconds, you will have a structured view of your strengths, weaknesses, opportunities, and threats across 12+ review platforms — the same starting point that drove the results in every case study above.
Frequently Asked Questions
Are these case studies based on real companies?
These case studies are composites — they are drawn from real patterns observed across dozens of companies using review intelligence, with details altered for confidentiality. The specific numbers represent realistic outcomes documented in similar real-world implementations. The methodologies described are exactly the processes that companies follow when conducting systematic review analysis.
What review volume do I need to replicate these kinds of results?
The SaaS case study worked with 680 reviews. The restaurant chain analyzed as few as 200 reviews per location. Even the smallest datasets produced actionable insights. For most businesses, 100 to 200 reviews across platforms provides sufficient data to identify your top two or three improvement opportunities. Higher volumes increase confidence but are not prerequisites for action.
How long does it typically take to see results from review-driven changes?
It depends on the type of change. Listing optimization (like GreenThread's) shows results within two to four weeks because it affects every new visitor immediately. Product changes (like SoundCore's ear tips) take three to six months because you need existing stock to cycle through and new reviews to accumulate. Operational changes (like Taverna's staffing and training) typically show review improvement within six to eight weeks as new customers experience the changed operations.
Can small businesses without dedicated analysts replicate these case studies?
Absolutely. Most of the analysis in these case studies can be conducted by a single person using Sentimyne's automated SWOT analysis. The 60-second multi-platform analysis replaces hours of manual review reading. A small business owner spending two hours on initial analysis and 30 minutes per week on monitoring can achieve the same types of insights — the scale may be smaller, but the methodology is identical.
What is the most common mistake companies make when starting review analysis?
Acting on individual reviews rather than patterns. A single dramatic one-star review about a rare product defect is not an action trigger — it is an anecdote. The value of review analysis comes from identifying themes that appear across dozens or hundreds of reviews. When 38% of reviews mention ear tip fit (as in SoundCore's case), that is an undeniable pattern demanding action. When one review mentions a niche complaint, that is useful context but not a strategic priority. Always look for the pattern before taking action.
Ready to try AI-powered review analysis?
Get 2 free SWOT reports per month. No credit card required.
Start FreeRelated Articles
Calculate the exact return on investment from review analysis using a proven formula. Covers revenue impact from rating improvements, cost savings from reduced support tickets, time savings from automation, and how to present the business case to leadership.
Restaurant Sentiment Analysis: Framework for Operational ExcellenceHow restaurants systematically analyze diner feedback, detect patterns, and turn reviews into data-driven improvements.
Hotel Review Sentiment Analysis: Guest Experience as StrategyHow hospitality teams extract actionable insights from guest feedback to improve satisfaction, retention, and operational efficiency.