App Store Review Analysis: How to Extract User Feedback at Scale
Learn how to analyze iOS App Store and Google Play reviews at scale. Discover how to categorize bugs, UX issues, and feature requests using AI-powered review analysis.
Your app has 14,000 reviews across the App Store and Google Play. Somewhere in that pile is the exact reason your retention rate dropped 8% last month. But you don't know which reviews contain the signal and which are noise — because nobody on your team has time to read 14,000 reviews.
This is the fundamental problem with app store reviews. They're the largest, most honest source of user feedback for any mobile product, and almost every app team underutilizes them. Not because they don't care, but because the volume is unmanageable and the format is unstructured.
Consider the math. A moderately successful app generates 50-200 new reviews per week across both platforms. That's 2,600-10,400 reviews per year. Even if each review takes 30 seconds to read, you're looking at 22-87 hours of reading per year — and reading isn't analyzing. Actually extracting themes, tracking sentiment trends, and connecting feedback to specific app versions requires dramatically more effort.
The apps that win aren't the ones with the best marketing. They're the ones that systematically extract and act on the feedback buried in their reviews. This guide shows you how to do exactly that.

Why App Store Reviews Are Unique
App store reviews aren't like Amazon product reviews or Trustpilot brand reviews. They have structural characteristics that make them both more valuable and harder to analyze.
Version-Specific Feedback
Every app store review is tagged with the app version the reviewer was using. This creates a natural experiment you don't get with other review types. You can measure exactly how each release affected user sentiment. Did version 3.2.1 fix the crash complaints from 3.2.0? Did the UI overhaul in version 4.0 create more complaints than it resolved?
This version linkage is extraordinarily valuable for product teams — but only if you're systematically tracking sentiment by version rather than looking at reviews in aggregate.
The Rating-Update Mechanism
Both the App Store and Google Play allow users to update their reviews after subsequent app updates. A user who left a 1-star review for a crash bug might update to 4 stars after you fix it — but only if they notice the fix. Tracking rating updates tells you whether your fixes are reaching and satisfying the users who complained.
Short-Form Feedback
App store reviews tend to be shorter than reviews on other platforms. The median App Store review is just 43 words. Google Play reviews average slightly longer at 57 words. This brevity means each review contains fewer data points, but the aggregate picture across hundreds or thousands of reviews is remarkably detailed.
Platform Behavioral Differences
iOS and Android users review differently, and understanding these differences matters for analysis:
iOS App Store reviewers tend to: - Write shorter reviews with more decisive sentiment (love it or hate it) - Focus more on design and aesthetics - Be less tolerant of ads and in-app purchase prompts - Rate more critically overall (average iOS review is 0.3 stars lower than the same app on Google Play)
Google Play reviewers tend to: - Write slightly longer reviews with more specific technical detail - Focus more on functionality and performance - Mention device compatibility issues more frequently - Provide more constructive criticism and feature suggestions
Analyzing both platforms together gives you the complete picture. Analyzing them separately reveals platform-specific issues that need platform-specific solutions.
What App Users Actually Complain About
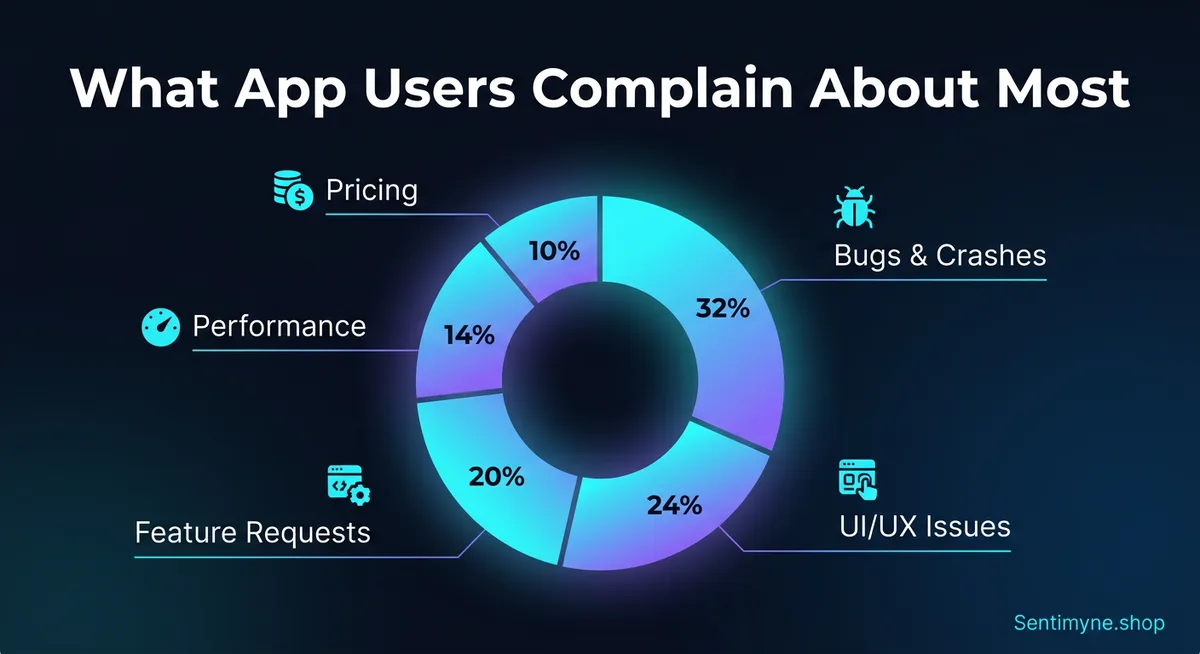
After analyzing review patterns across hundreds of apps, clear category distributions emerge. These percentages vary by app category, but the overall pattern is remarkably consistent:
| Category | % of Negative Reviews | Examples |
|---|---|---|
| Bugs & crashes | 32% | "Crashes every time I open it," "Login broken since update" |
| UI/UX issues | 24% | "Can't find the settings," "Too many taps to do anything" |
| Missing features | 20% | "Needs dark mode," "Why can't I export to PDF?" |
| Performance | 14% | "So slow on my phone," "Drains battery like crazy" |
| Pricing & IAP | 10% | "Used to be free," "Subscription too expensive" |
Bugs & Crashes (32%)
Bugs are the single largest driver of negative app reviews. But "bugs" is too broad to be actionable. Effective analysis breaks this category into sub-types:
- Crash on launch — The most damaging. Users can't even access your app. Often version-specific or device-specific.
- Feature-specific crashes — "It crashes when I try to upload a photo." These are easier to reproduce and fix because reviewers typically describe the exact trigger.
- Data loss — "I lost all my progress." This generates the most emotional negative reviews and is almost impossible to recover from.
- Login/authentication failures — "Can't log in with my Google account since the update." Extremely common after authentication system changes.
- Sync issues — "My data doesn't sync between my phone and tablet." Frustrating for users with multiple devices.
UI/UX Issues (24%)
UX complaints are the most actionable category because they often come with specific descriptions of what's wrong:
- Navigation confusion — Users can't find features they need. This is a sign that your information architecture needs work.
- Workflow friction — "Too many steps to do [simple task]." Count the taps in your most common user journeys.
- Visual design complaints — "Text is too small," "Colors hurt my eyes," "Can't read in sunlight."
- Accessibility issues — "Doesn't work with VoiceOver," "No way to increase text size."
- Onboarding friction — "Forced me to create an account just to look around."
Missing Features (20%)
Feature requests in app reviews are free product research. When hundreds of users independently ask for the same feature, that's market validation you didn't have to pay for. Common request patterns include:
- Platform parity — "Android version is missing [feature] that iOS has"
- Export/sharing — Users want to get their data out of your app
- Customization — Dark mode, themes, layout options
- Integrations — Connect with other apps and services
- Offline functionality — "Useless without wifi"
Performance (14%)
Performance complaints map directly to technical metrics:
- App size — "Takes up too much storage"
- Load times — "Takes forever to open"
- Battery drain — "Kills my battery in 2 hours"
- Memory usage — "My phone gets hot when using this app"
- Network usage — "Uses too much data"
Pricing & In-App Purchases (10%)
Pricing complaints have a unique dynamic. They're often not about the absolute price but about perceived value and fairness:
- Free-to-paid transitions — "This used to be free, now everything is behind a paywall"
- Subscription fatigue — "Not another subscription app"
- Feature gating — "Basic features should be free"
- Price-to-value ratio — "Not worth $9.99/month for what it does"
- Trial experience — "Trial was too short to evaluate properly"
Version-Specific Sentiment Tracking
One of the most powerful applications of app review analysis is tracking how sentiment changes across versions. Here's what this looks like in practice:
| Version | Period | Avg Rating | Top Negative Theme | Theme Sentiment |
|---|---|---|---|---|
| 3.1.0 | Jan 1-15 | 4.2 | Battery drain | -0.54 |
| 3.1.1 | Jan 16-31 | 4.0 | Login failures | -0.72 |
| 3.2.0 | Feb 1-14 | 3.4 | UI confusion (redesign) | -0.68 |
| 3.2.1 | Feb 15-28 | 3.7 | UI confusion | -0.45 |
| 3.2.2 | Mar 1-15 | 4.1 | Battery drain (returned) | -0.38 |
This table tells a clear story: version 3.2.0 introduced a UI redesign that tanked ratings. Version 3.2.1 patched the worst confusion points and partially recovered. By 3.2.2, the dust settled and an older issue (battery drain) resurfaced as the top complaint. Without version-specific tracking, you'd see a messy average that obscures these dynamics.
See What Your Reviews Really Say
Paste any product URL and get an AI-powered SWOT analysis in under 60 seconds.
Try It Free →How to Use Version Tracking
Before a release: Analyze current reviews to establish a sentiment baseline for each major theme. Know your weakest areas before you ship.
After a release: Wait 48-72 hours for reviews to accumulate, then run analysis. Compare the new theme distribution against the pre-release baseline. Did the themes you targeted improve? Did new problems emerge?
During incident response: If your monitoring flags a rating drop, immediate review analysis tells you whether it's a specific bug (fixable with a hotfix) or a broader UX issue (requires a more considered response).
How to Prioritize Mobile Fixes Using Review Data
Not all review feedback deserves equal attention. Here's a prioritization framework that product teams can apply immediately:
The Frequency-Severity Matrix
Plot each identified issue on two axes: - Frequency: How many reviews mention this issue? (horizontal axis) - Severity: How negative is the sentiment when it's mentioned? (vertical axis)
Quadrant 1 — High Frequency + High Severity: Fix Now These issues affect many users and generate strong negative reactions. Examples: crash on launch, data loss, broken core features. These are your P0 issues.
Quadrant 2 — Low Frequency + High Severity: Fix Soon These affect fewer users but create intense frustration. Examples: accessibility failures, edge-case data corruption. These might be affecting specific device types or user segments.
Quadrant 3 — High Frequency + Low Severity: Improve Gradually Many users mention these but they're more annoying than enraging. Examples: minor UI quirks, missing quality-of-life features. These are good candidates for iterative improvement.
Quadrant 4 — Low Frequency + Low Severity: Backlog Few users mention these and the sentiment isn't strongly negative. Monitor but don't prioritize.
Connecting Reviews to Retention
The ultimate value of app review analysis is its connection to retention. Users who experience the issues described in negative reviews often don't leave reviews — they just stop using your app. For every user who writes "crashes when I upload a photo," there are likely 10-50 users who experienced the same crash and silently churned.
This means review frequency is a conservative estimate of actual impact. A bug mentioned in 50 reviews might be affecting 500-2,500 users. Factor this multiplier into your prioritization.
Analyzing App Store Reviews With Sentimyne
Sentimyne supports both Apple App Store and Google Play URLs, making cross-platform analysis seamless.
The workflow is simple:
- Copy the App Store or Google Play URL for any app — yours or a competitor's
- Paste it into Sentimyne — the platform auto-detects the source and version data
- Receive a SWOT analysis in 60 seconds — strengths (features users love), weaknesses (bugs and UX issues), opportunities (most-requested features), threats (competitor mentions and churn signals)
- Share with your team — the structured SWOT format maps directly to product, engineering, and design team responsibilities
For product managers, this means you can walk into a sprint planning meeting with data-backed priorities instead of anecdotal "I've been hearing complaints about..." arguments. For engineering leads, it means you can quantify the user impact of technical debt. For designers, it means you can see exactly which UX flows are creating friction.
Competitive App Analysis
The same workflow applies to competitor apps. Paste a competitor's App Store or Google Play URL into Sentimyne and you'll see their strengths and weaknesses from the user's perspective. This is invaluable for:
- Feature gap analysis — What do users love about your competitor that you don't offer?
- Weakness exploitation — What are users complaining about that you could do better?
- Marketing positioning — Use competitor weaknesses in your App Store description and ad copy
- Roadmap validation — If users are asking your competitor for features you already have, that's a marketing opportunity
Building an App Review Monitoring System
One-time analysis is useful. Continuous monitoring is transformative. Here's how to build a systematic approach:
Release-Cycle Monitoring
Tie review analysis to your release cycle. Run analysis: - Pre-release: Establish baseline sentiment - 48 hours post-release: Early signal detection - 1 week post-release: Comprehensive impact assessment - Pre-next-release: Final impact measurement
Weekly Aggregate Analysis
Independent of releases, run a weekly analysis to catch: - Emerging issues unrelated to your changes (OS updates, third-party SDK issues) - Competitor-related mentions (users comparing, considering switching) - Seasonal patterns (holiday usage spikes, back-to-school patterns)
Keyword Alert Monitoring
Track specific keywords that signal urgent issues: - "Crash," "broken," "bug," "lost data" — Engineering alerts - "Confusing," "can't find," "too complicated" — Design alerts - "Expensive," "not worth," "canceling subscription" — Business alerts - "Switching to," "better than," "competitor name" — Competitive alerts
The iOS vs. Google Play Analysis Strategy
Because the two platforms attract different user behaviors, your analysis strategy should account for platform-specific patterns:
For iOS App Store
Focus on: design quality feedback, premium user expectations, Apple ecosystem integration issues (iCloud sync, Handoff, Widgets), privacy-related concerns.
iOS users are more likely to mention aesthetic issues and less likely to provide detailed technical information about bugs. When they report crashes, they often describe the symptom without the context (device model, OS version) that helps reproduce the issue.
For Google Play
Focus on: device compatibility across the Android ecosystem, performance on lower-end devices, permission concerns, ad experience feedback.
Google Play reviewers tend to provide more technical detail and are more forgiving of design imperfections. They're more likely to report device-specific issues ("doesn't work on my Samsung Galaxy A52") and more likely to suggest specific feature implementations.
Cross-Platform Comparison
Run the same analysis on both platforms and compare results. If a bug appears on iOS but not Android (or vice versa), it's likely platform-specific code. If a UX complaint appears on both platforms, it's a design issue, not an implementation issue. These distinctions save engineering time by routing issues to the correct team immediately.
Frequently Asked Questions
How many app reviews do I need before analysis is useful?
A minimum of 50-100 reviews provides enough data for basic theme identification. For statistically meaningful sentiment tracking and trend analysis, 200+ reviews is ideal. Most apps with 10,000+ downloads have sufficient review volume for comprehensive analysis. If your app has fewer reviews, focus on individual review reading until volume builds — then switch to AI analysis as you scale.
Should I analyze iOS and Android reviews separately or together?
Both. Analyze them together first to understand overall user sentiment and major themes. Then analyze each platform separately to identify platform-specific issues. A bug that only appears in iOS reviews likely stems from platform-specific code. A feature request that appears on both platforms validates it as a universal need rather than a platform-specific preference.
How do I handle fake or spam app reviews?
Both Apple and Google have automated systems to detect and remove fake reviews, but some slip through. AI analysis tools like Sentimyne process all reviews in aggregate, which naturally dilutes the impact of individual spam reviews. If you notice obviously fake reviews (keyword-stuffed, irrelevant content, bulk-posted), report them through the respective developer console. Focus your analysis energy on the authentic reviews rather than trying to filter manually.
Can app review analysis predict churn?
Not directly, but it's a powerful leading indicator. When negative sentiment around core features spikes after an update, churn typically follows 2-4 weeks later. Reviews mentioning competitor alternatives ("thinking about switching to...") are the strongest churn signal. By monitoring these patterns weekly, you can identify and address churn-causing issues before they show up in your retention metrics.
How do I get my team to actually use review analysis insights?
Structure is the key. Raw review data overwhelms teams and gets ignored. Structured SWOT output from tools like Sentimyne maps directly to team responsibilities: Weaknesses go to engineering, Opportunities go to product management, Threats go to marketing and growth. Present review insights in sprint planning meetings with specific quotes and frequency data. When an engineer sees "247 users reported this crash" rather than "some people are complaining about crashes," the priority becomes self-evident.
Ready to try AI-powered review analysis?
Get 2 free SWOT reports per month. No credit card required.
Start FreeRelated Articles
Apple App Store and Google Play Store reviews are your closest connection to active users. Learn how to systematically analyse app reviews to identify UX friction, missing features, competitive threats, and sentiment shifts that drive install decisions and app store rankings.
Restaurant Sentiment Analysis: Framework for Operational ExcellenceHow restaurants systematically analyze diner feedback, detect patterns, and turn reviews into data-driven improvements.
Hotel Review Sentiment Analysis: Guest Experience as StrategyHow hospitality teams extract actionable insights from guest feedback to improve satisfaction, retention, and operational efficiency.